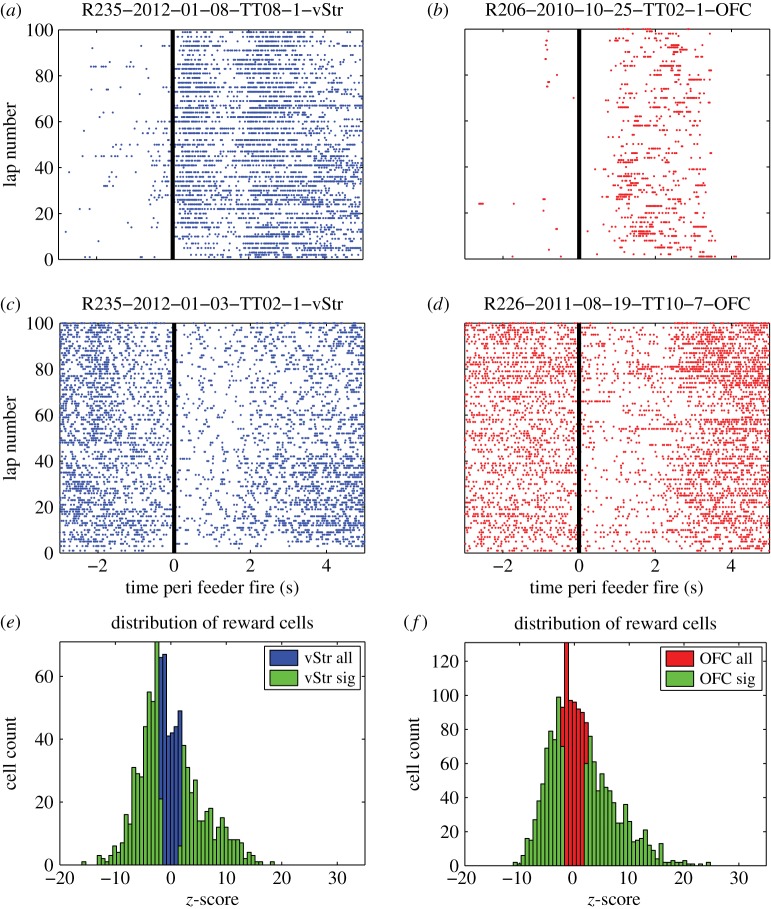
Figure 2.
Examples of reward-responsive cells. Example single unit recordings from vStr (a) and OFC (b) that showed a significant increase in firing rate around the time of reward receipt. Other cells showed a significant decrease in their firing rate around the time of reward receipt (c,d). The distribution of firing rates around the time of reward receipt is shown for all cells in vStr (n = 947) (e) and OFC (n = 1754) (f) in blue (black in print) and red (dark grey in print), respectively. Cells that significantly changed their firing rate (z-test, p < 0.05) compared with a bootstrap distribution (see Material and methods) are overlaid in green (light grey in print). (Online version in colour.)

