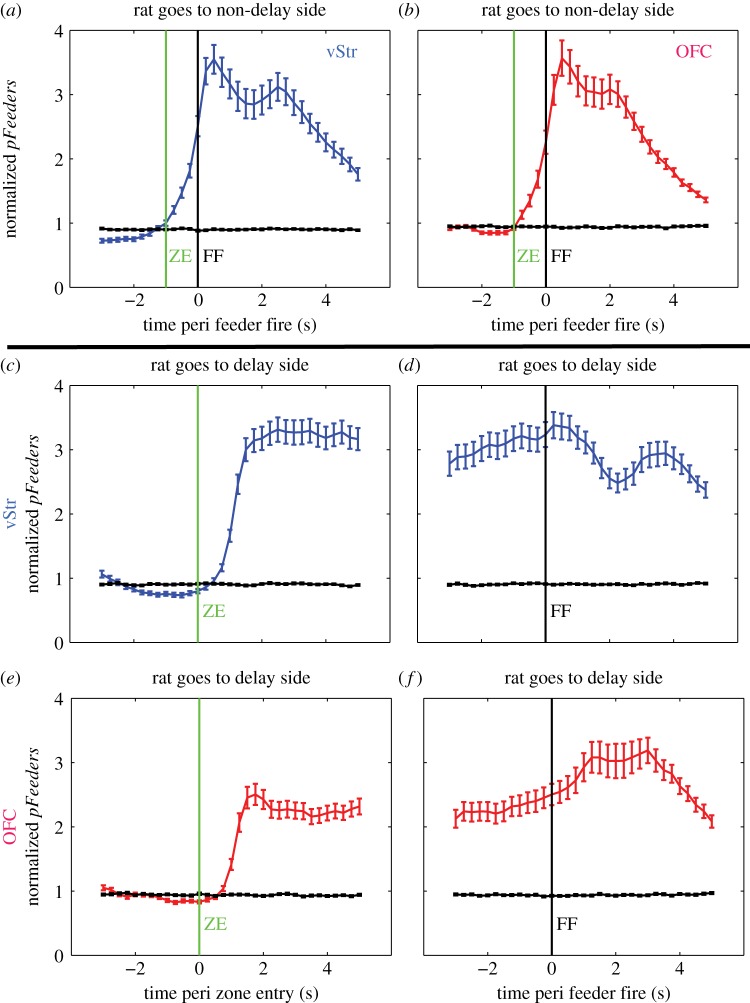
Figure 3.
Ensemble decoding to reward sites. Each row shows PETHs of Bayesian ensemble decoding to the feeder sites (normalized pFeeders). Only sessions with at least five cells in each structure were included in this analysis (n = 85 sessions). Lines represent the average across sessions, with error bars representing the standard error of the mean (s.e.m.). (a,b) Decoding for laps when the rat chose the non-delay side. ‘ZE’ indicates feeder zone entry (which coincides with choice point exit) and ‘FF’ indicates when the feeder fires the pellet reward. (c,e) Feeder site decoding for laps when the rat chose the delay side, aligned to feeder zone entry. Decoding remained high during the delay. (d,f) Decoding aligned to feeder fire (FF) while the rat waited at the delayed feeder site. Note that pFeeders values were high at the end of the delay, but still peaked slightly after the feeder click and pellet delivery. (Online version in colour.)

