Figure 4.
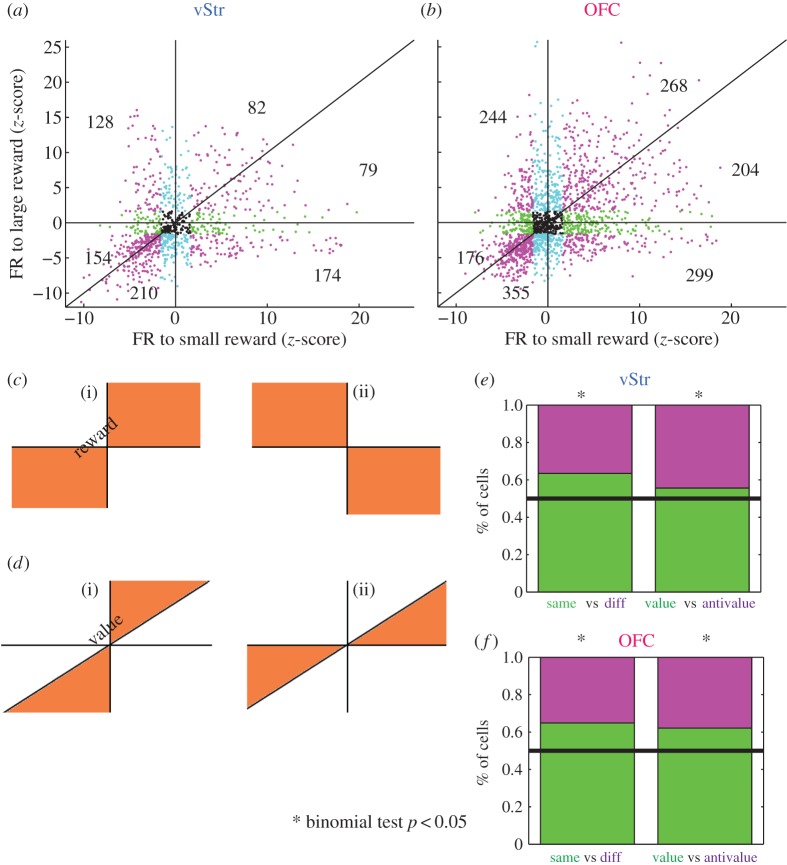
Single cells code for reward and for value. Firing rate in response to reward at each feeder location for all vStr cells (n = 947) (a) and all OFC cells (n = 1754) (b). Cells that did not show a significant change in firing rate are displayed in black. Significance was determined by comparing reward responses to a bootstrapped distribution (see Material and methods). For significance, blue denotes large reward; green, small reward; magenta , both rewards (cell counts for all blue, green or magenta cells are shown within each of the six sectors); black, non-significant. (c) Diagram showing what reward coding should look like. Axes as in (a,b). If single cells are responsive to reward, they should either increase their firing rate at both feeders, or decrease their firing rate at both feeders (c(i): ‘same’, upper right and lower left quadrants). Firing rate changes in the opposite direction are incompatible with reward coding (c(ii): ‘diff’, upper left and lower right quadrants). (d) Diagram showing what value coding should look like. Axes as in (a,b). If neurons code not only for reward in general but also for the specific value of reward, then changes in firing rate should be greater for the three pellet reward than for the one pellet reward (d(i): ‘value’, |large|>|small|). Firing rate changes in the opposite direction are incompatible with value coding (d(ii): ‘anti’, |small|>|large|). (e,f) The left side of each bar graph shows the percentage of reward-responsive cells classified as reward coding (‘same’ versus ‘diff’). The right half of each bar graph shows the percentage of cells that demonstrated value coding (‘value’ versus ‘anti’). In both structures, significantly more cells coded for reward than not and for value than not (binomial test, p < 0.05). (Online version in colour.)

