
Figure 6.
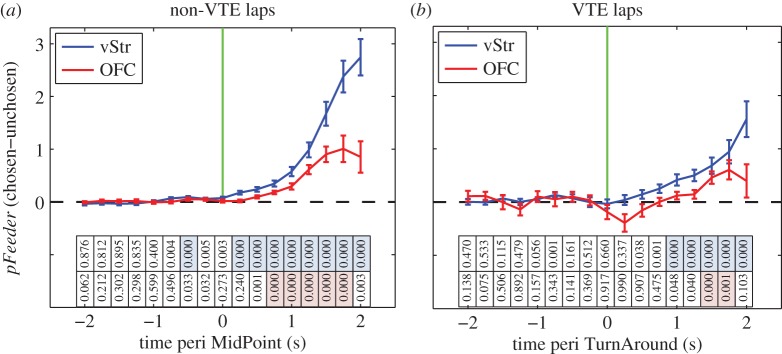
Separate feeder site representations during choice. Decoding values were averaged within session, as in figure 5. Lines represent the average across sessions, with error bars representing the s.e.m. (a) Decoding to the chosen feeder site minus decoding to the unchosen feeder site for non-VTE passes. The vertical green line marks the MidPoint time. Values above the dotted line indicate greater decoding to the chosen feeder site. Statistics show t-tests for each time bin, with the null hypothesis that pFeeder was not significantly greater than zero (right tailed), Bonferonni corrected for 17 time bins, two brain structures, and two behavioural conditions: α = 0.000735. p-Values are shown directly below each time bin in both (a) and (b). Time bins where pFeeder(chosen − unchosen) was significantly greater than zero are indicated by blue and pink shading, for vStr and OFC, respectively. (b) Chosen side minus unchosen side decoding for VTE passes. The vertical green line marks the TurnAround start time. Statistical analysis as in (a). Significant time bins for vStr preceded those for OFC on both non-VTE passes and VTE passes. (Online version in colour.)