
Figure 1.
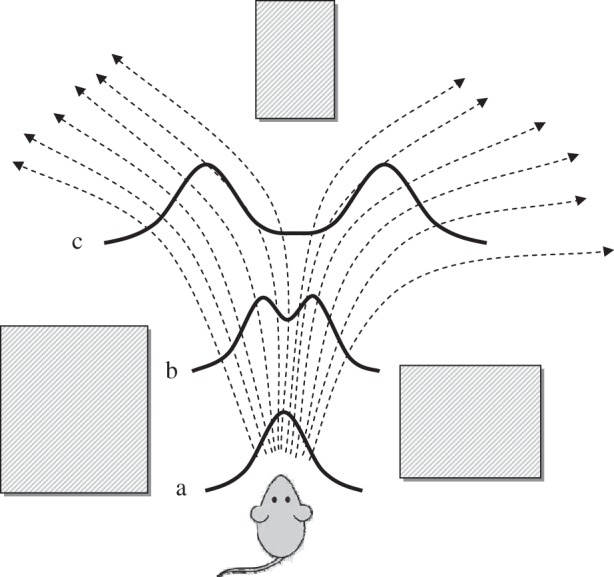
Schematic embodied decision-making scenario. Dotted line arrows indicate possible paths for the mouse to move between obstacles depicted by shaded rectangles. Solid curves indicate the distribution of potential directions at three points in time. At point (a), the distribution can be averaged into a single central direction. At point (b) the distribution begins to separate, but averaging is still possible. At point (c), however, the average is no longer a viable direction and a decision must be made between directions to the right or left.