
Figure 2.
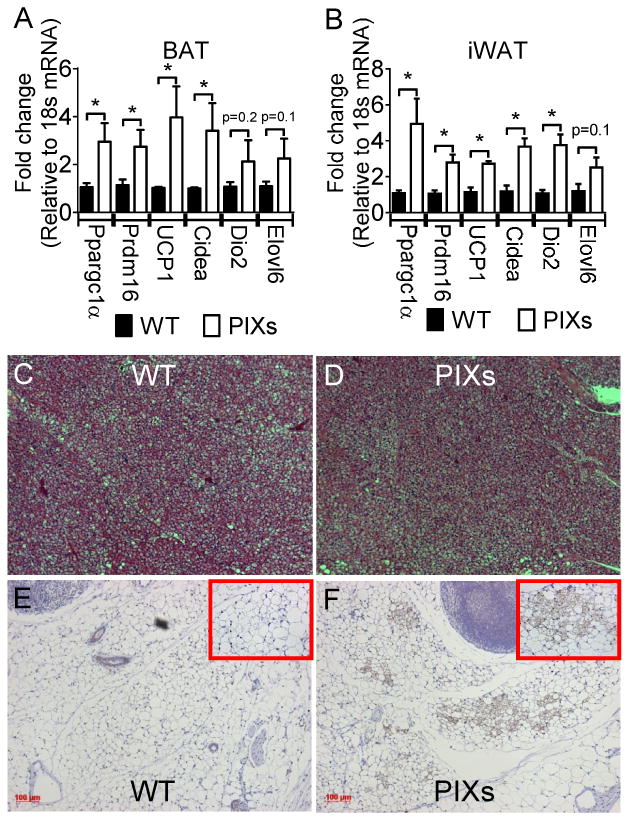
PIXs mice express increased thermogenic markers in BAT and iWAT. Weight matched PIXs mice were fed HFD DOX enriched diet for 2 weeks. qPCR was performed to examine the relative expression Ppargc1α, Prdm16, UCP1, Cidea, Dio2, and Elovl6 which are known genes associated with heat production in (A) BAT and (B) iWAT. *, p < 0.05. Brown adipose tissue (BAT) from (C) WT and (D) PIXs mice was imaged by light microscopy after hematoxylin-eosin staining. Inguinal white adipose tissue from (E) WT and (F) PIXs mice was imaged by light microscopy after UCP-1 immunohistochemistry. Bars, 100μm. (note C and D are the same scale as E and F).