
Figure 7.
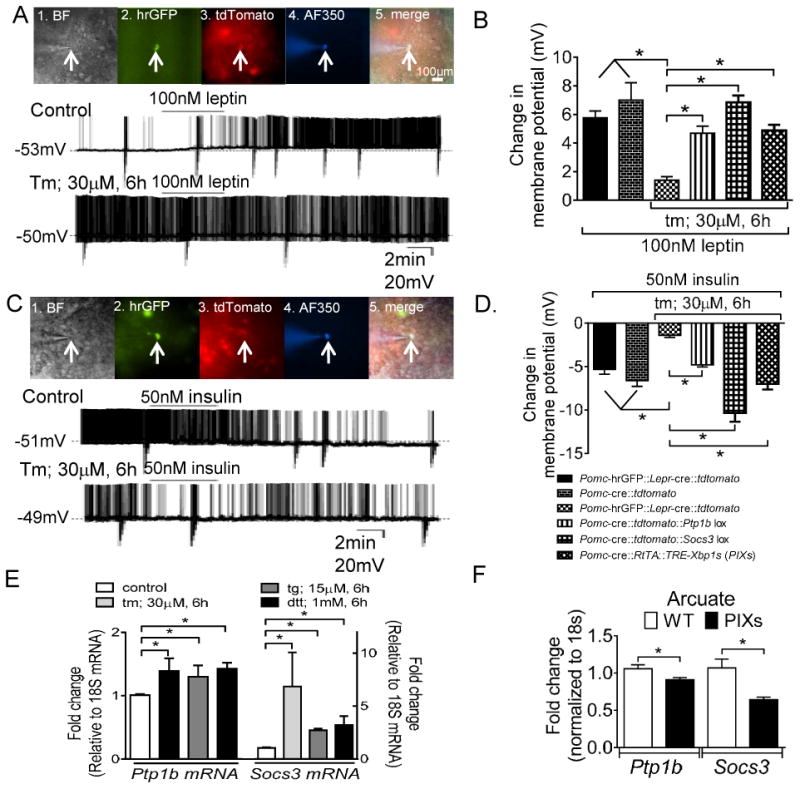
ER stress blunts the leptin-induced activation and the insulin-induced inhibition of Pomc neurons. (A) 1. Brightfield illumination of Pomc-hrGFP::Lepr-cre::tdtomato neuron from PLT mice. 2. and 3. The same neuron under FITC (hrGFP) and Alexafluor 594 (tdtomato) illumination. 4. Complete dialysis of Alexa Fluor 350 from the intracellular pipette. 5. Merge image illustrates colocalization of hr-GFP, tdtomato, and Alexa Fluor 350 indicative of a Pomc neuron which expresses Leprs. Control (above). Electrophysiological study demonstrates a Pomc-hrGFP::Lepr-cre::tdtomato (green/red) neuron that depolarized in response to leptin. Below demonstrates a current clamp recording of a separate Pomc-hrGFP::Lepr-cre::tdtomato (green/red) neuron in which ER stress blunted the leptin induced depolarization. (B) Histogram demonstrating that multiple activators of ER stress blunted the leptin-induced activation of Pomc neurons (n= 8-15 per group). Deletion of either Ptp1b or Socs3 restores the leptin-induced excitation of arcuate Pomc neurons after ER stress induction. Similarly, constitutive expression of Xbp1s in Pomc neurons restores the leptin-induced excitation of arcuate Pomc neurons after ER stress induction. *P < 0.05. Error bars indicate SEM. (C) 1. Brightfield illumination of Pomc-hrGFP neuron from PLT mice. 2. and 3. The same neuron under FITC (hrGFP) and Alexafluor 594 (tdtomato) illumination. 4. Complete dialysis of Alexa Fluor 350 from the intracellular pipette. 5. Merge illustrates colocalization of hr-GFP and Alexa Fluor 350 indicative of a Pomc neuron which does not expresses Leprs. Control (above): Electrophysiological study demonstrates a Pomc-hrGFP (green) neuron is hyperpolarized in response to insulin. Below: A separate Pomc-hrGFP (green) neuron in which ER stress blunts the insulin induced hyperpolarization. (D) Histogram illustrating that chemical activation of ER stress blunts the insulin-induced inhibition of arcuate Pomc neurons (n= 8-18 per group). Deletion of either Ptp1b or Socs3 restores the insulin-induced inhibition of arcuate Pomc neurons after ER stress induction. *P < 0.05, Error bars indicate SEM. (E) Relative mRNA expression of Socs3 and Ptp1b in organotypic slices following pretreatment with ER stress activators. (F) Relative mRNA of Ptp1b and Socs3 in the arcuate nucleus from PIXs and WT mice fed HFD-Dox. (*P < 0.05, values are means ±SEM from 3-6 independent experiments, error bars indicate SEM)