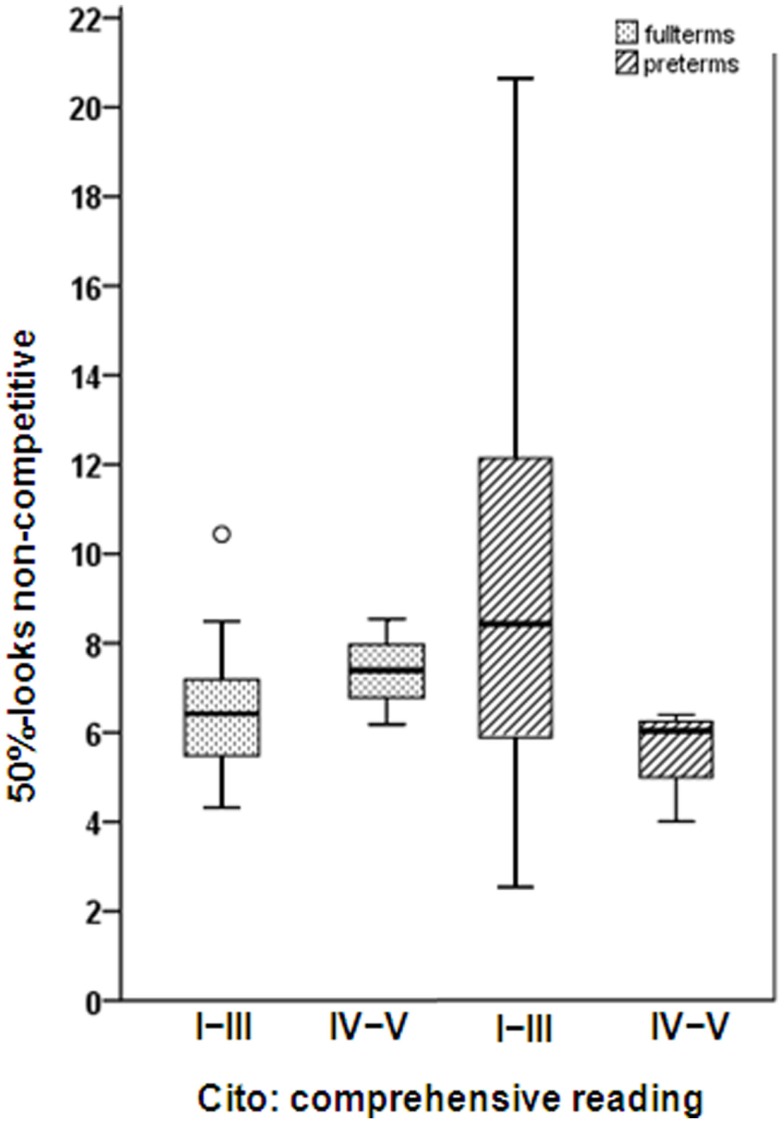
Figure 2.
Age in weeks at which the infant reached a relative frequency of looks of 50% (50%-looks) under the non-competitive condition in fullterm-born (dotted) and preterm-born children (hatched) with normal (Levels I–III) and abnormal (Levels IV–V) scores on the Cito comprehensive reading test. The data in the graphs are presented as box and whisker plots. Boxes represent the individual values between the 25th and 75th centiles (interquartile range); whiskers represent the range of the values, with the exception of outliers. The outliers are represented by the circles and defined as values between 1.5 interquartile range and 3 interquartile ranges from the end of a box.

