Fig. 3.
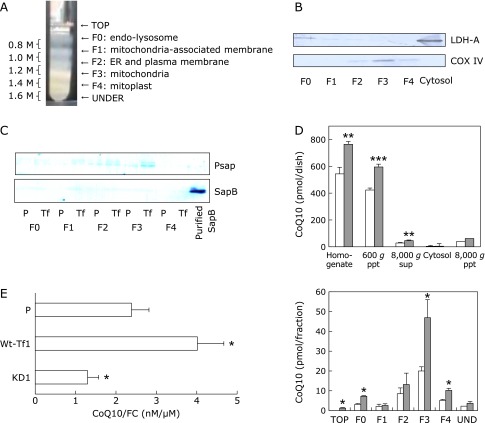
Preparation of subcellular fractions and their CoQ10 content. (A) Sucrose gradient separation of mitochondria (F3) and mitoplasts (F4). (B) Confirmation of fractionation by western blot analysis using mitochondria-specific COX IV and cytosol-specific LDH-A antibodies. (C) Psap and SapB measurement of each fraction obtained from parental (P) and Psap transfected (Wt-Tf1) HepG2 cells by western blot analysis using monoclonal anti-sapB IgG. (D) CoQ10 contents in homogenates of parental (white bars) and Psap transfected (Wt-Tf1) HepG2 cells (with similar protein concentrations, gray bars) and their separated fractions by step-wise centrifugation as well as sucrose gradient fractions of 8,000 g pellets. *, ** and *** indicate significant differences (p<0.05, 0.01 and 0.001, respectively) between the two cells. (E) Ratios of CoQ10 to FC (CoQ10/FC) in mitochondrial fractions obtained by sucrose-mannitol separation of parental (P) and one of each Psap transfected (Wt-Tf1) and Psap knockdown (KD1) HepG2 cells. * indicates a significant difference (p<0.05) compared to values for parental HepG2 cells.

