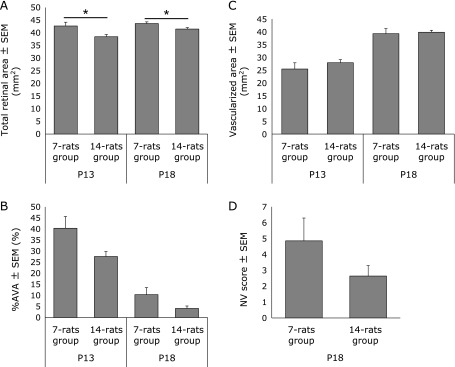
Fig. 4.

Transitional change in TRA (A), %AVA (B), VA (C) and NV scores (D). Data are expressed as mean ± SEM (n = 7 in the 7-rat groups and n = 14 in the 14-rat groups at each time point). *p<0.05. %AVA in 7-rats group was relatively larger than that of 14-rats group at both P13 and P18, but there was no significant difference (B). There was no significant difference in (C) or in (D).
