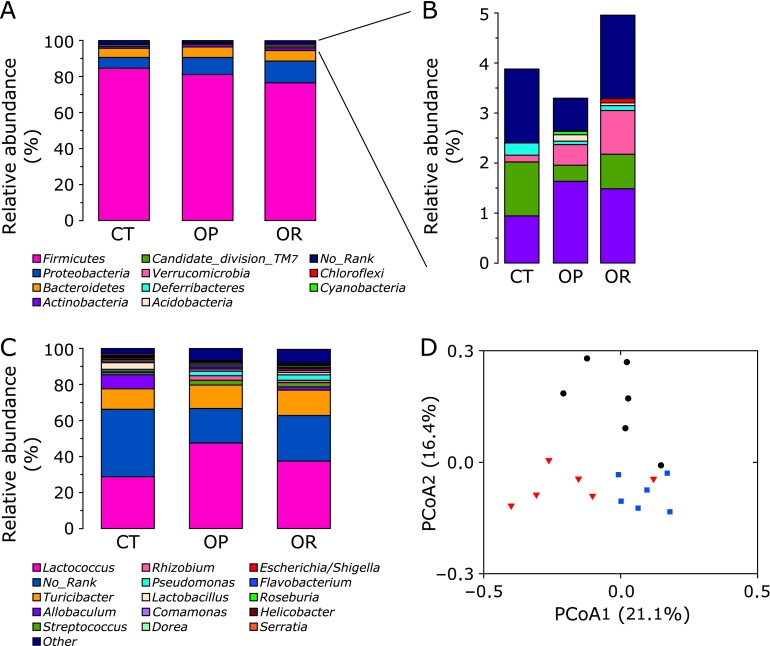
Fig. 3.
Relative abundances of distinct major phyla are shown in panel (A). Other minor phyla with trace abundance are shown in panel (B). Relative abundances of distinct genus are shown in panel (C) (the results were obtained by using BLASTN combined with MEGAN). (D) Principal component analysis plots (PcoA) were constructed based on the unweighted UniFrac distance metric. CT: black circle, OP: red triangle, OR: blue square. CT, normal chow diet-fed mice; OP, high-fat diet-induced obesity-prone mice; OR, high-fat diet-induced obesity-resistant mice.

