
Figure 1.
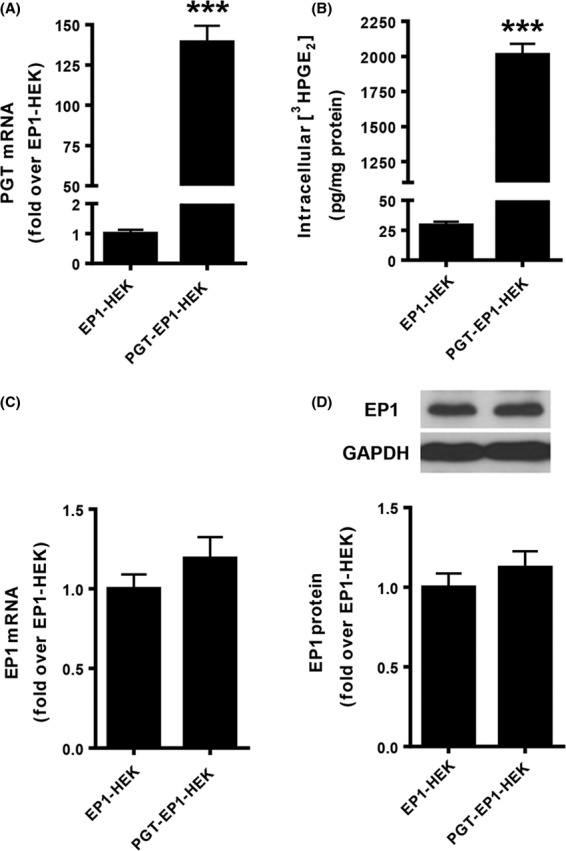
Properties of EP1-HEK and PGT-EP1-HEK cell lines. (A and C) PGT and EP1 mRNA expression levels in EP1-HEK and PGT-EP1-HEK cell lines. Cells were seeded onto six-well plates and harvested 72 h after seeding. Total RNA was extracted and mRNA was determined by qRT-PCR. PGT-EP1-HEK cells expressed ∼140-fold more PGT mRNA than EP1-HEK cells, whereas EP1-HEK and PGT-EP1-HEK cells expressed comparable levels of EP1 mRNA. (B) 3H-PGE2 uptake in EP1-HEK and PGT-EP1-HEK cell lines. Cells were seeded onto 24-well plates and 3H-PGE2 uptake was measured 72 h after seeding. PGT-expressing cells exhibited 60- to 70-fold more 3H-PGE2 uptake than EP1-HEK control cells. (D) EP1 protein expression levels in EP1-HEK and PGT-EP1-HEK cell lines. Cells were seeded onto 10-cm plates and harvested 72 h after seeding. Protein was extracted and quantified by Western blot. Upper panel shows a representative immunoblot; lower panel shows quantitation of three blots. EP1-HEK and PGT-EP1-HEK cells exhibited no difference in EP1 protein expression. Values are mean ± SEM (n = 3 for each experiment). ***P < 0.0001 by t-test.