
Figure 2.
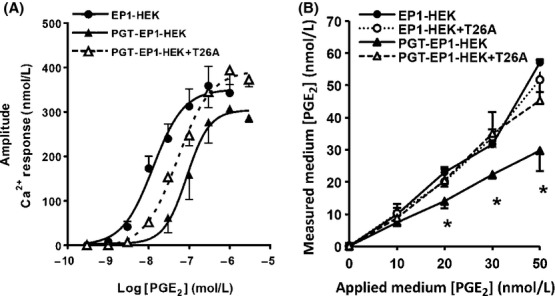
PGT modulates PGE2-induced Ca2+ responses and medium PGE2 levels. (A) Dose-dependent responses of the increase in intracellular Ca2+ concentration induced by PGE2 stimulation of EP1-HEK (n = 37 cells), and of PGT-EP1-HEK cells in the absence (n = 211 cells) and presence of the PGT blocker T26A (5 μmol/L, n = 340 cells). PGT shifted the PGE2/Ca2+ dose–response curve to the right; PGT inhibition by T26A reversed this effect (see text for statistical analyses). (B) Final PGE2 concentration in media following 10 min exposure to EP1-HEK or PGT-EP1-HEK monolayers in the presence and absence of T26A (5 μmol/L). PGT expression lowered the medium PGE2 concentration. Values are mean ± SEM (n = 3 for each experiment). *P < 0.05.