
Figure 3.
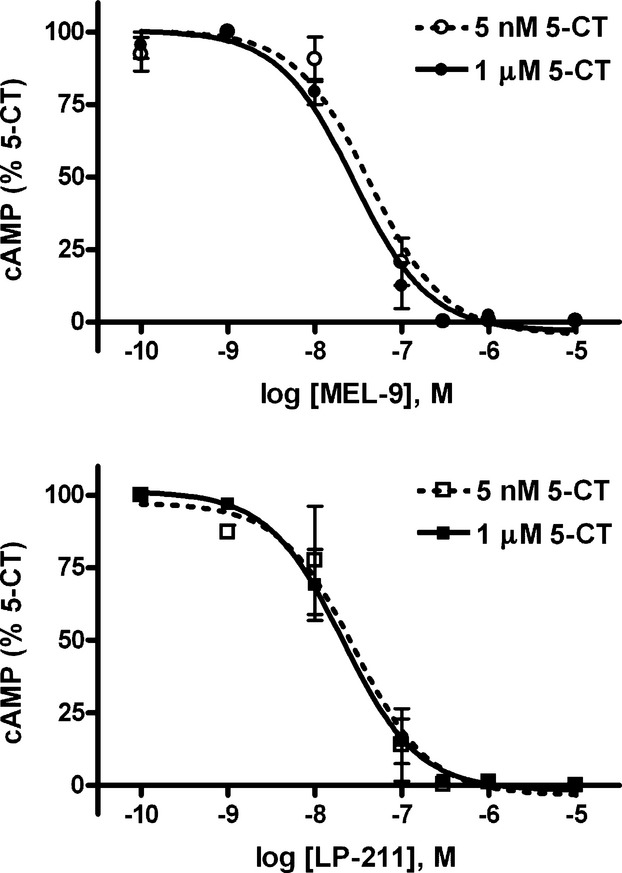
Concentration–response curves for MEL-9 and LP-211 on 5 nmol/L or 1 μmol/L 5-CT-stimulated cAMP production in HEK-hu5-HT7 cells. Cells were preincubated in the absence (control) or presence of the compounds at different concentrations (100 pmol/L–10 μmol/L) for 15 min prior to the addition of 5 nmol/L or 1 μmol/L 5-CT and incubation for 15 min. Basal values were subtracted from 5-CT-stimulated values and expressed as percent of the control 5-CT response. 5 nmol/L 5-CT elicited a cAMP response over basal equal to 44.3 ± 1.6% of the response elicited by 1 μmol/L 5-CT. Data are the mean values ± SEM from three independent experiments performed in triplicate.