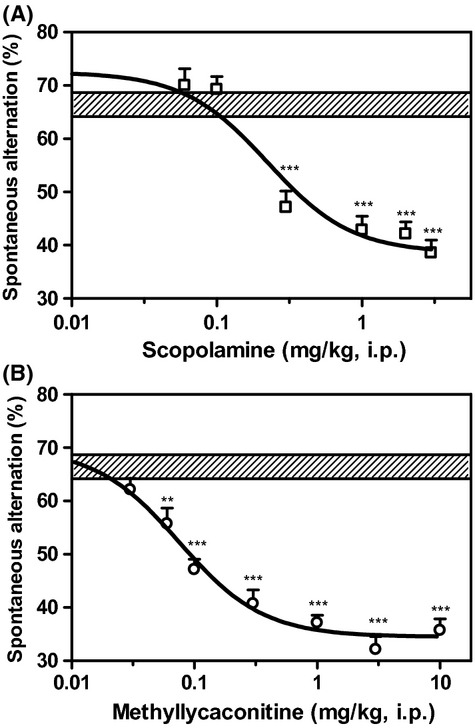
Figure 1.

Dose–response curves of scopolamine (A) and MLA (B), showing dose-dependent reduction in spontaneous alternation of mice in the T-maze. Hatched horizontal bar shows the range of performance level of control mice in the T-maze. Data are expressed as mean ± SEM of n = 10–12 mice. **P ≤ 0.01; ***P ≤ 0.001, significantly different as compared with the performance of control mice.
