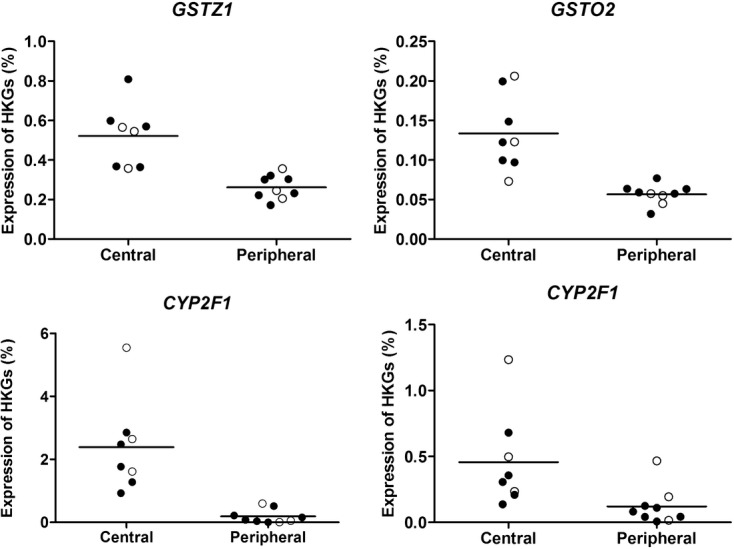
Figure 4.

Individual expression pattern of top four genes encoding drug-metabolizing enzymes with higher expression in central airways. Graphs show expression levels of individual genes encoding drug-metabolizing enzymes with the lowest P-values (unadjusted and from two-sided tests) regarding differential expression between central airways and peripheral tissue. Black circles denote COPD patients and unfilled circles denote healthy subjects.
