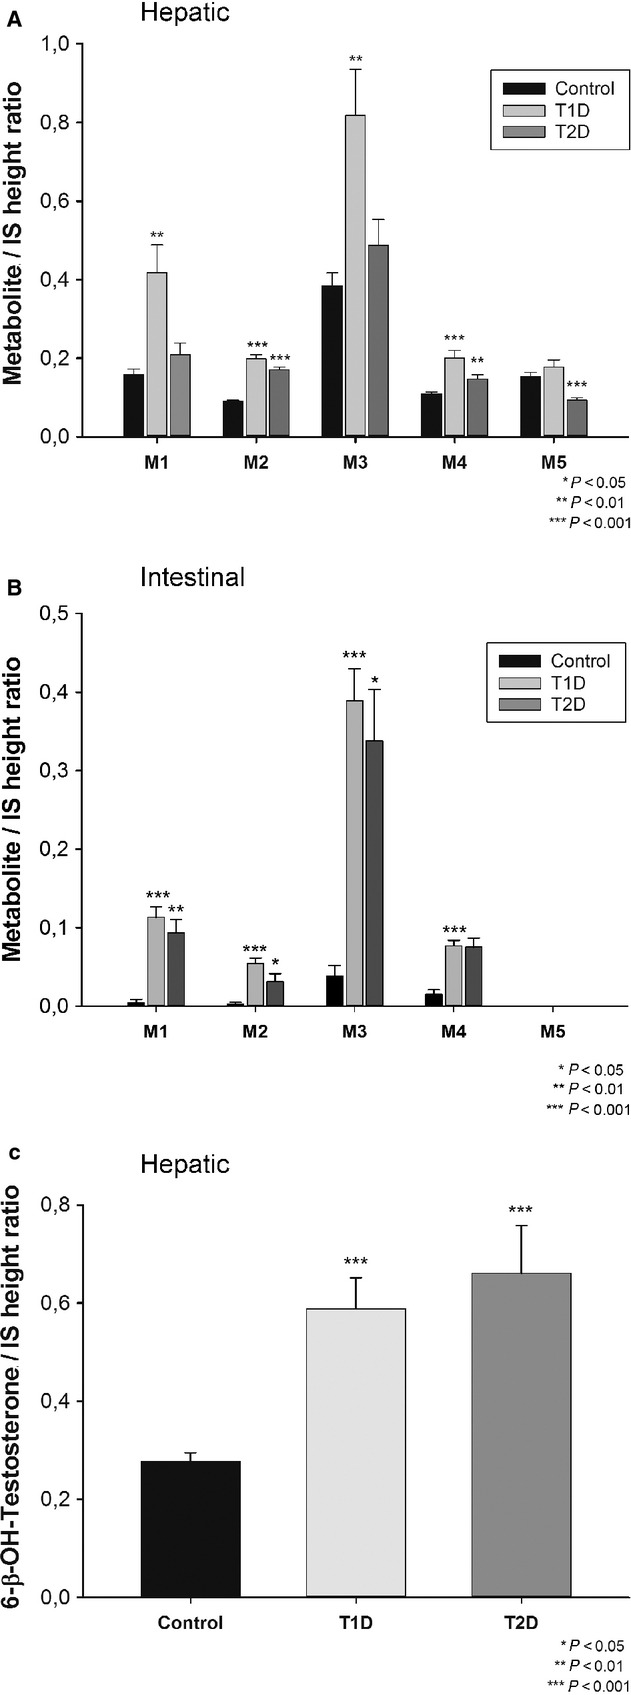
Figure 1.

(A) Hepatic microsomal CYP3a activity: This figure shows peak-height ratios of metabolites of domperidone to internal standard for the three groups. Formation of four of the five metabolites (M1-4) were significantly increased in the T1D group (M1: 0.417 ± 0.071, M2: 0.199 ± 0.011, M3: 0.818 ± 0.117, M4: 0.201 ± 0.019, M5: 0.178 ± 0.018; n = 17) when compared to the control group (M1: 0.158 ± 0.014, M2: 0.090 ± 0.003, M3: 0.384 ± 0.033, M4: 0.109 ± 0.005, M5: 0.152 ± 0.011; n = 14). In the T2D group, M2 and M4 were significantly increased while M5 was significantly decreased (M1: 0.209 ± 0.029, M2: 0.171 ± 0.007, M3: 0.487 ± 0.065, M4: 0.147 ± 0.011, M5: 0.093 ± 0.006; n = 18). Metabolites of domperidone were not formally identified. (B) Intestinal microsomal CYP3a activity: Formation of the four metabolites was significantly increased in both T1D (M1: 0.113 ± 0.013, M2: 0.054 ± 0.007, M3: 0.389 ± 0.040, M4: 0.077 ± 0.007; n = 8) and T2D (M1: 0.093 ± 0.017, M2: 0.032 ± 0.010, M3: 0.338 ± 0.065, M4: 0.075 ± 0.011; n = 6) groups when compared to the control group (M1: 0.004 ± 0.004, M2: 0.002 ± 0.002, M3: 0.039 ± 0.013, M4: 0.015 ± 0.006; n = 8), except for M4 in the T2D group. (C) Hepatic microsomal CYP3a activity: This figure shows peak-height ratios of the CYP3a-catalized metabolite of testosterone to internal standard for the three groups. Formation of 6-β-OH-testosterone was significantly increased in both T1D and T2D groups when compared to control group (0.588 ± 0.063, 0.661 ± 0.098 vs. 0.277 ± 0.018; n = 15, 17, 16, respectively)
