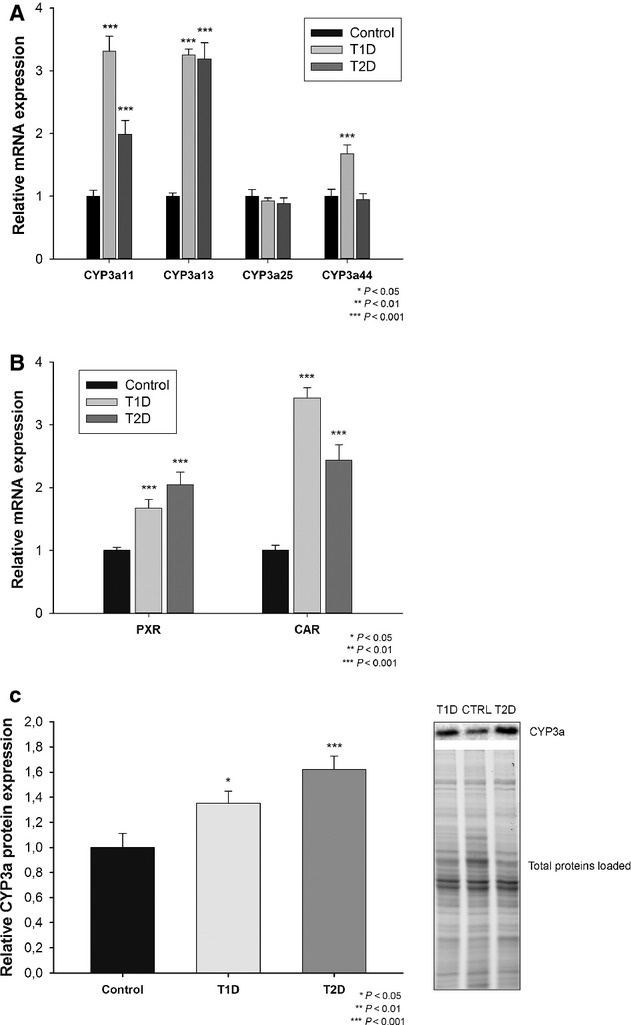
Figure 2.

(A) Relative steady-state levels of CYP3a mRNAs in mouse livers. A significant increase of CYP3a11 and CYP3a13 was observed for both T1D and T2D groups when compared to the control group (3a11: 3.31 ± 0.24, 1.99 ± 0.22 vs. 1.00 ± 0.10; n = 17, 20, 18 respectively) (3a13: 3.25 ± 0.10, 3.19 ± 0.26 vs. 1.00 ± 0.05; n = 17, 20, 17 respectively), and for CYP3a44 in T1D group (1.68 ± 0.14, 0.95 ± 0.10 vs. 1.00 ± 0.11; n = 17, 20, 17 respectively). No significant difference was observed for CYP3a25 (0.93 ± 0.05, 0.89 ± 0.09 vs. 1.00 ± 0.11; n = 17, 19 respectively). (B) Relative steady-state levels of PXR and CAR mRNAs in mouse livers. A significant increase of PXR and CAR was observed in both T1D and T2D groups when compared to the control group (PXR: 1.67 ± 0.14, 2.04 ± 0.20 vs. 1.00 ± 0.05; n = 17, 19, 17 respectively) (CAR: 3.43 ± 0.16, 2.44 ± 0.24 vs. 1.00 ± 0.08; n = 17, 15 respectively). (C) Relative expression of CYP3a proteins in mouse livers. On the left, a significant increase was observed in both T1D and T2D groups when compared to the control group (1.35 ± 0.106, 1.62 ± 0.11 vs. 1.00 ± 0.11; n = 17, 18, 17 respectively). On the right are the representative images of the ChemiBlot of CYP3a and the total proteins loaded for the three groups.
