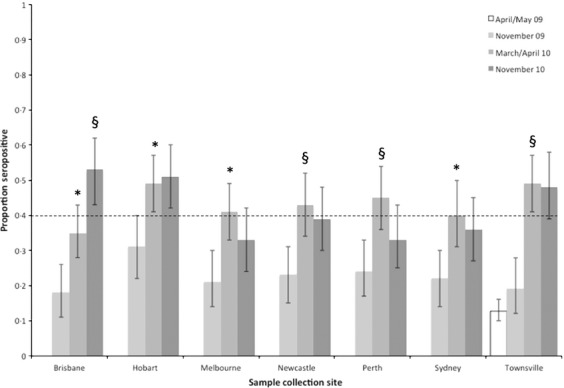
Figure 4.

Seropositive proportion over time by city, with 95% binomial confidence intervals. Significant changes in proportion from the previous timepoint are denoted *P < 0·05; §P < 0·005 (see also Table S2). The dotted line indicates the 40% seropositive proportion, achieved by all cities but Brisbane prior to the 2010 winter. Note: pre-pandemic specimens were only available from the Townsville collection centre.
