
Figure 4.
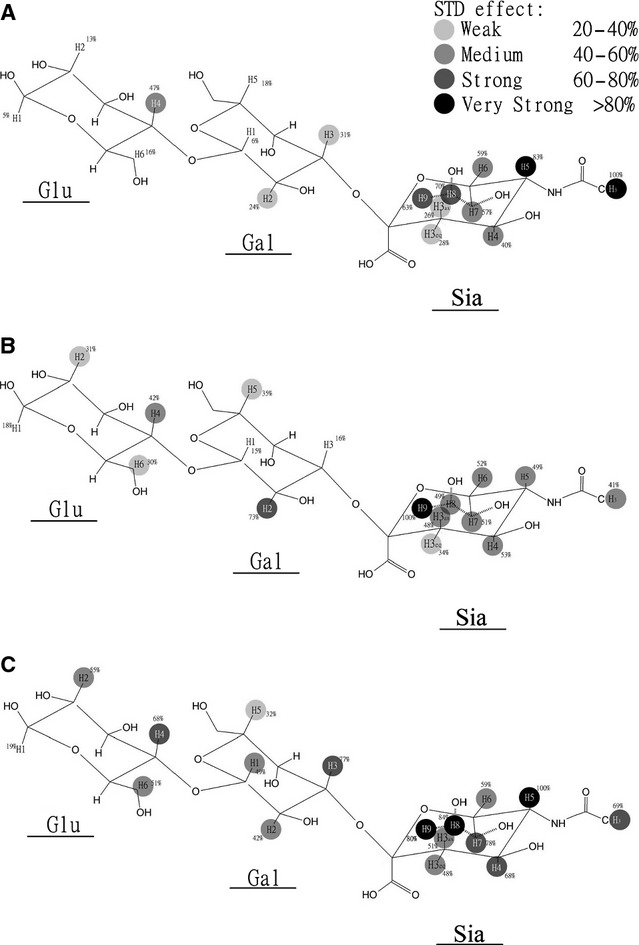
Epitope map of 3′SL with NA-VLPs, of which N1 was derived from avian H5N1 (A), human seasonal (B), or pandemic (C) H1N1 viruses. The strongest STD signal was set to 100% (as indicated in the figure), and relative STD-NMR effects (ASDT) were calculated accordingly (percentage on the structures). Difference of saturation transfer difference (D-STD) spectra was calculated by subtraction of STD-NMR spectra acquired for SLs binding to NA-VLP obtained in the presence or in the absence of oseltamivir, respectively.