
Figure 3.
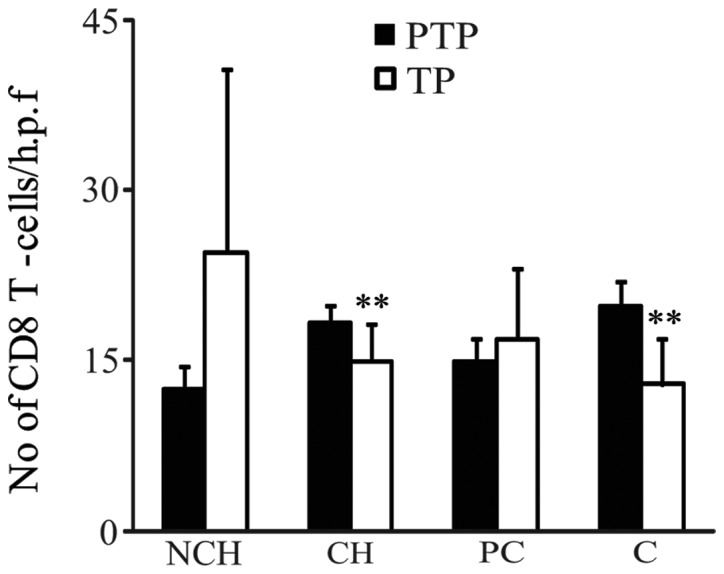
CD8 expression in hepatocellular carcinoma (TP) and paired peritumor liver tissues (PTP). Morphometrical analysis was performed for semi-quantitative evaluation of the immunohistochemical findings. Data are presented as the mean ± standard error of the mean. Statistical analysis was performed using the nonparametric Mann-Whitney U test. **P<0.01, PTP vs. TP in CH and C background groups. NCH, non-chronic hepatitis; CH, chronic hepatitis; PC, pre-cirrhotic stage; C, cirrhosis; PTP, peritumor parenchyma; TP, tumor parenchyma; h.p.f., high-power field.