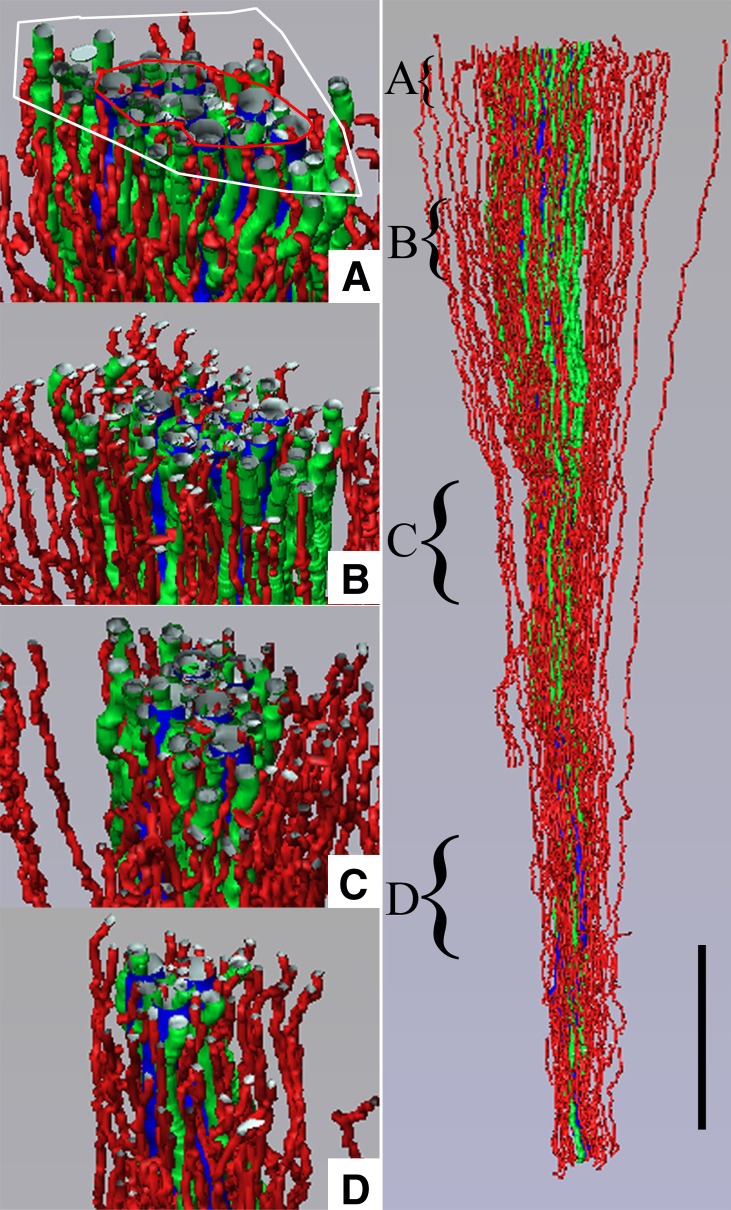
Figure 5.
Three-dimensional reconstruction showing spatial relationships of AVR (red tubules) and ATLs (green tubules) to CDs (blue tubules) for the same CD cluster shown in Figure 3. ATLs and AVR reside within both the intercluster and intracluster regions, and A–D show that this relationship continues along the entire axial length of the CD cluster. Axial positions of A–D are indicated by the curly brackets in the right panel. Tubules are oriented in a corticopapillary direction, with the upper edge of the image near the base of the inner medulla. The interstitial area within the red boundary line is the “intracluster” region and the interstitial area between the red and white boundary lines is the “intercluster” region. Scale bar, 500 μm. Reproduced from reference 39 with permission.

