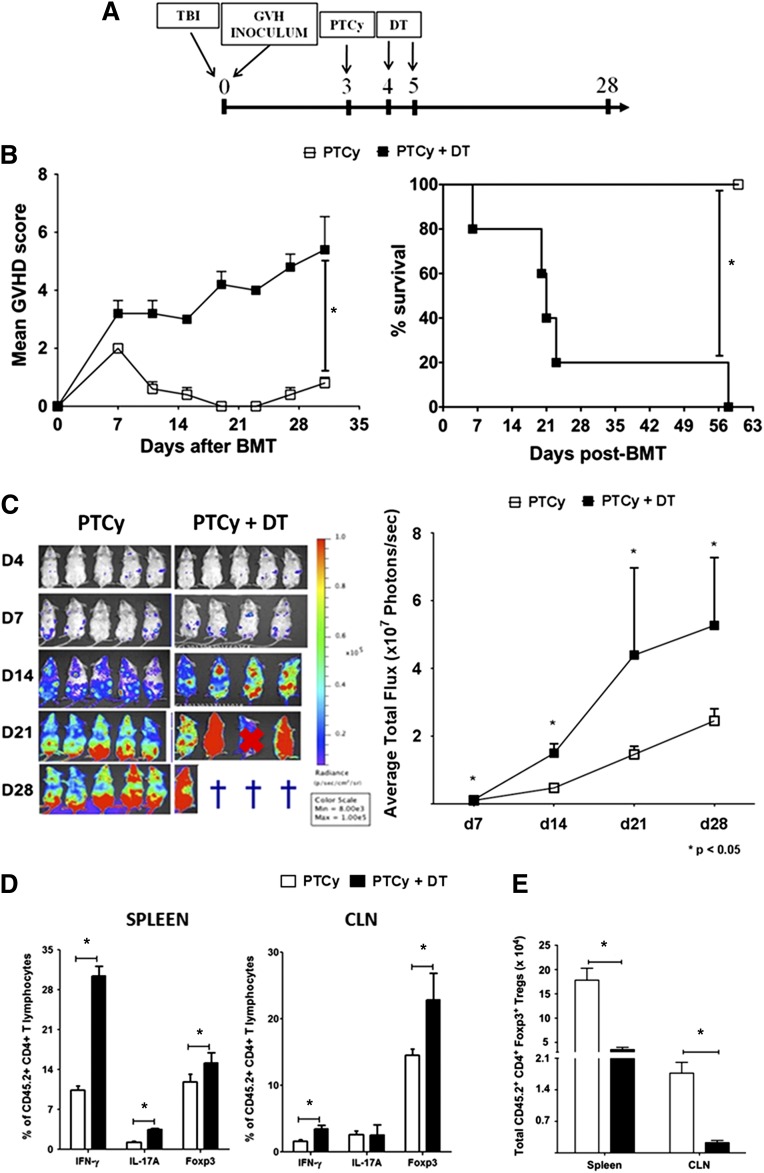
Figure 6.
Donor CD4+Foxp3+ Treg depletion after PTCy treatment accelerates GVHD. (A) Experimental design. Chimeras were constructed as in Figure 2, except that the GVH inocula were obtained from B6.luc+.Foxp3DTR donors. PTCy (200 mg/kg IP) was administered on day +3 after alloBMT. DT (50 ng/g) or PBS was injected on days +4 and +5. Luciferase expression by luc+ cells in the GVH inocula was quantified in vivo by injection of luciferin and acquisition of bioluminescent signal. All animals were monitored daily for survival and scored twice weekly for GVHD until day +60, when the experiments were terminated. (B) GVHD scores (left panel) and survival (right panel) of chimeras (n = 10 per group) that were monitored until day +60 in 2 independent experiments. (C) Kinetics of BLI after PTCy-induced CD4+Foxp3+ donor Treg depletion. (Left panel) BLI imaging of luciferase-expressing cell distribution at serial time points after alloBMT. Color bars represent the signal intensity scale. ×, weak subject succumbed to anesthesia; †, subjects died before imaging time point. (Right panel) Expansion of luciferase-expressing T cells as quantified by total emitted photons per mouse and group at serial time points after alloBMT. Displayed are pooled results from 2 independent experiments (n = 10 per group), distinct from those shown in (B). On day +28 post-BMT, spleens and CLNs were harvested for flow cytometric analysis of intracellular cytokines and Foxp3 expression. (D) Percentages of cytokine-producing or Foxp3-expressing GVH inocula–derived (CD45.2+) CD4+ T cells. (E) Total numbers of CD4+CD45.2+Foxp3+ Tregs in the spleens and CLNs. Data shown are from day +28 survivors of 2 independent experiments (n = 10 [PTCy]; n = 5 [PTCy+DT]).

