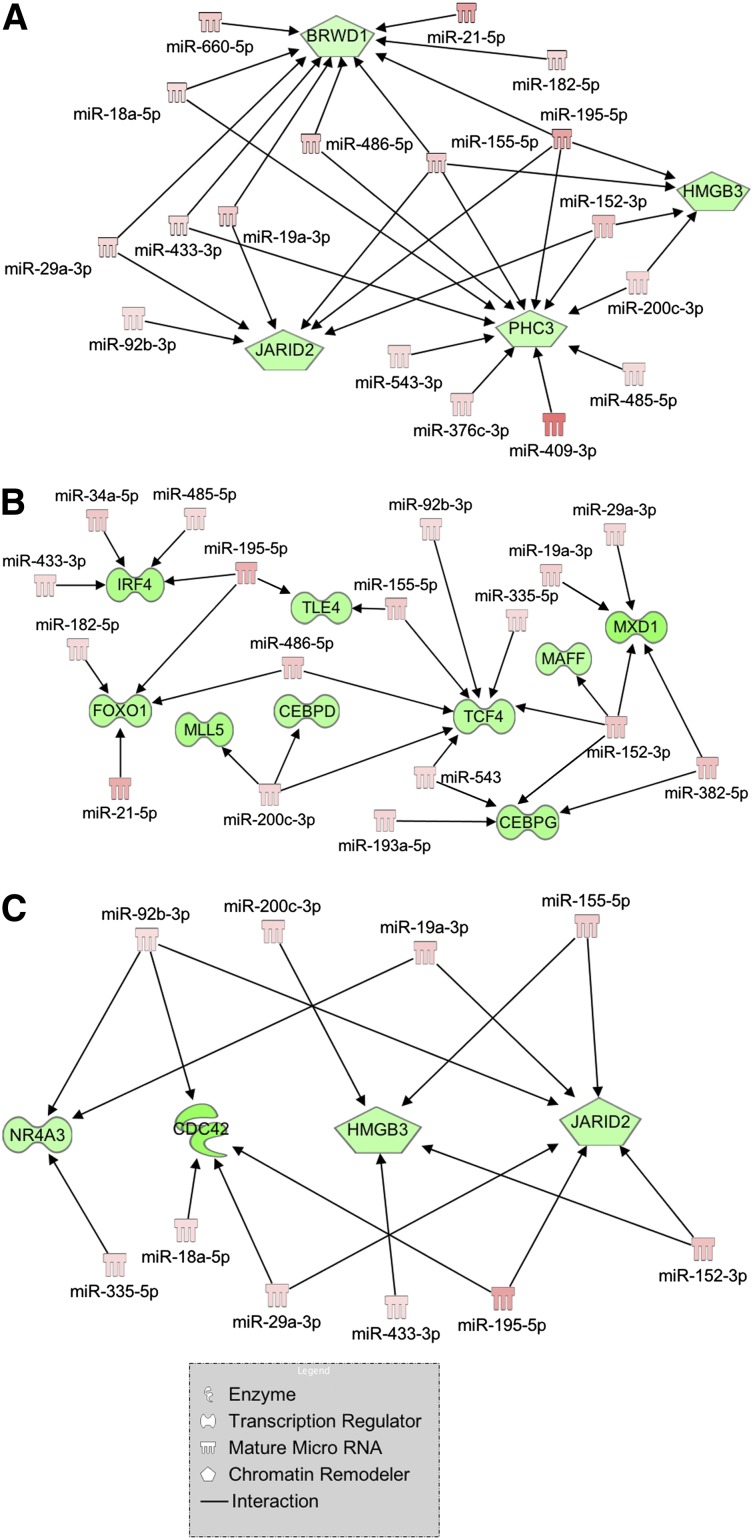
Figure 3.
Regulatory networks of mRNA-miRNA interactions built through IPA. Visualization of the regulatory networks enriched for chromatin remodeling genes (A), myeloid transcription factors (B), and myeloproliferative disorder-related genes (C). Red filling means upregulation, and green filling indicates downregulation.

