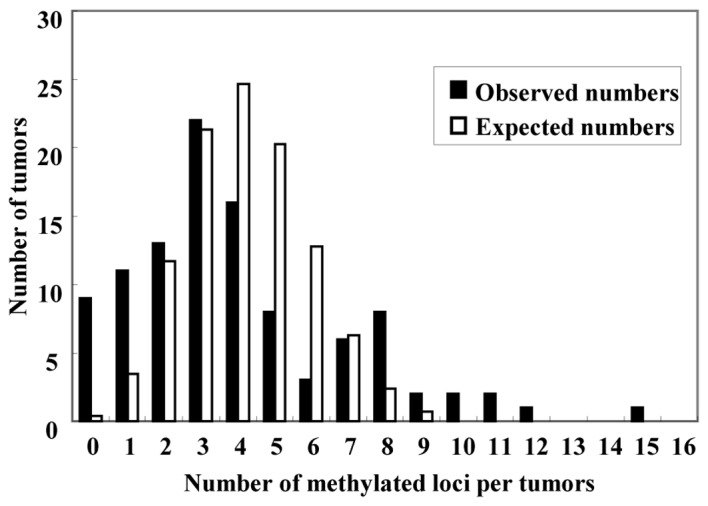
Figure 1.

Distribution of the number of tumors and methylated loci per tumor. The expected number is represented by a white bar, and the observed number by a black bar. The observed distribution of carcinomas with each number of aberrantly methylated genes appeared divided into two groups between the high and low methylated groups. With the CpG island methylator phenotype (CIMP) classification used, there was a significant difference between the expected and observed tumor distribution (goodness-of-fit test, P<0.001). Carcinomas with methylation of ≥7 of the 15 genes was classified as CIMP-high, methylation of 1–6 genes as CIMP-low, and without any methylation as CIMP-negative.
