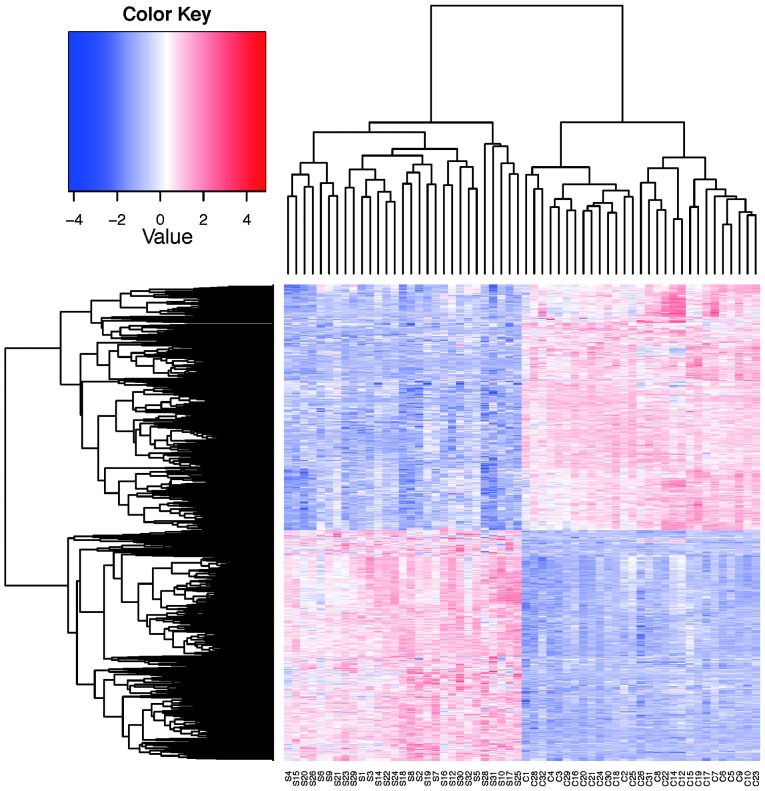
Figure 1.
2D hierarchical dendrograms clustered the differentially-expressed genes and studied individuals. The horizontal axis shows the clustering of subjects (S, tumor Samples; C, control; numbers, subject codes), and the vertical axis represents the clustering of the differentially-expressed genes according to their RMA normalized expression intensities.

