Figure 2.
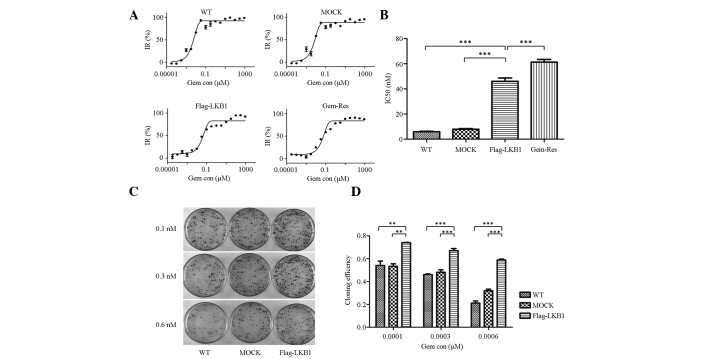
Forced LKB1 expression is associated with increased gemcitabine chemoresistance. (A) Semilogarithmic dose-response curves of cytotoxicity assays as measured by Cell Counting Kit-8 assay. (B) Estimated IC50 value of wild-type, mock-transfected, LKB1-transfected and gemcitabine-resistant sublines of MDA-MB-231 cells. The IC50 value of LKB1-transfected cells was higher than that of wild-type and mock-transfected cells; however, it was lower than that of the gemcitabine-resistant subline. Each independent experiment was performed in triplicate and data are presented as the mean ± SD. (C) Cloning efficiency of the three cell lines at three different concentrations (0.1, 0.3 and 0.6 nM) of gemcitabine. The control group contained 100 cells/dish without gemcitabine. Cloning efficiency was calculated using the following formula: Cloning efficiency (%) = (clone number/total cell number)/(control clone number/control total cell number) × 100. Each independent experiment was performed in triplicate and the data are presented as the mean ±SD. (D) Colony formation assays revealed higher clonogenicity in LKB1-transfected cells when compared with wild-type and mock-transfected cells, in the presence of gemcitabine. (*P<0.05, **P<0.01 and ***P< 0.001). IR, inhibition rate; Gem con, gemcitabine concentration; LKB1, liver kinase B1; WT, wild type.

