
Table 2.
Mutation distribution
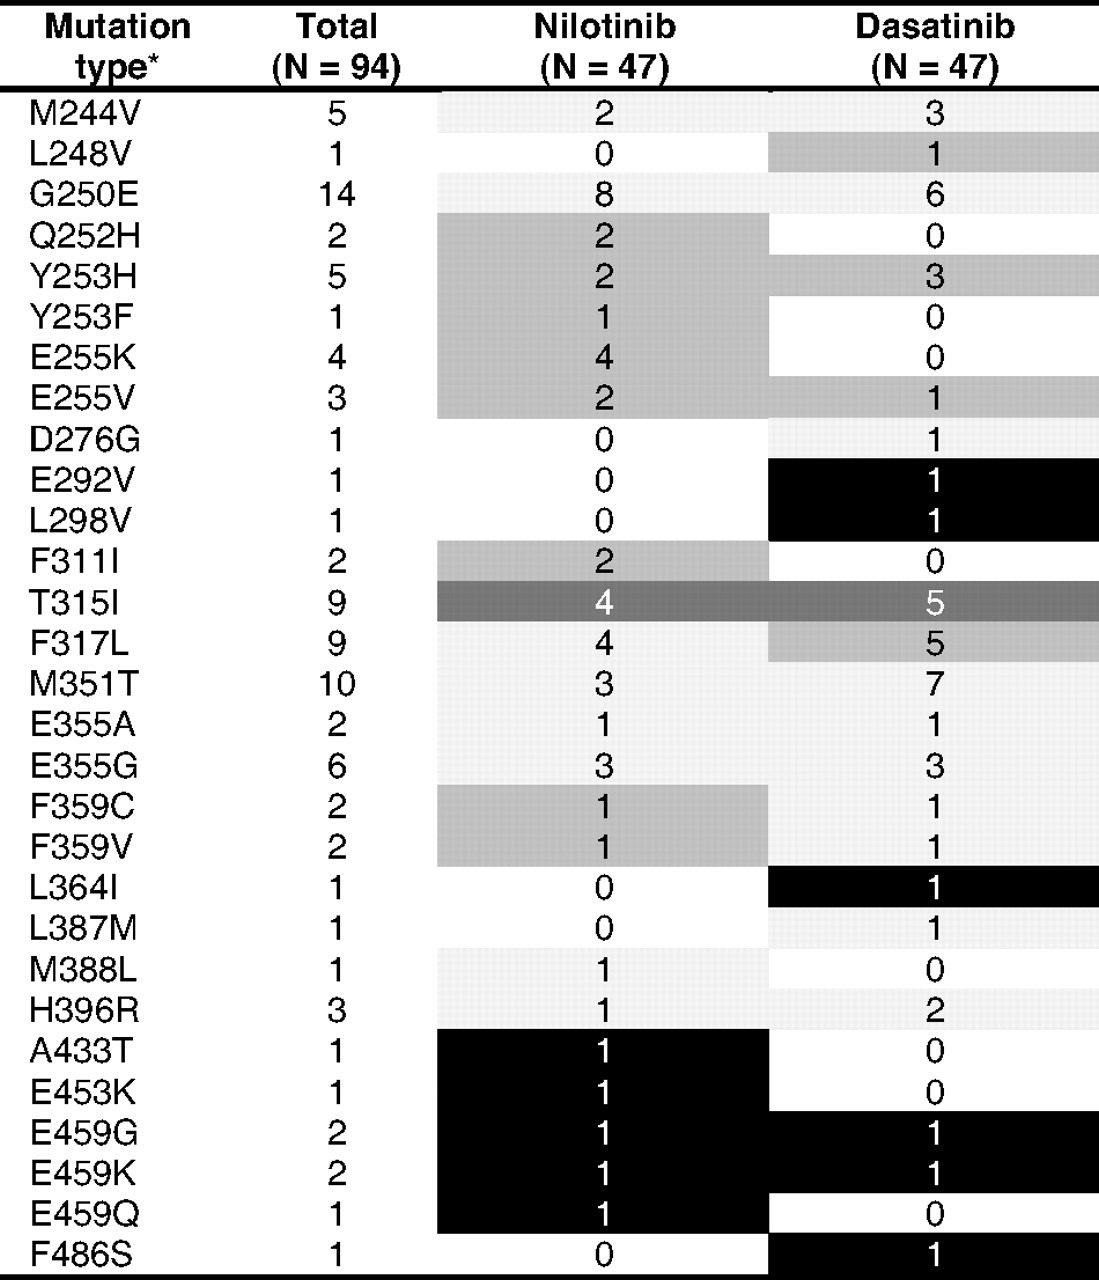
Light gray indicates low IC50; intermediate gray, intermediate IC50; dark gray, high IC50; and black, unknown IC50.
*Seven patients harbored more than 1 mutation (6 harbored 2 and 1 harbored 3).
Official websites use .gov
A
.gov website belongs to an official
government organization in the United States.
Secure .gov websites use HTTPS
A lock (
) or https:// means you've safely
connected to the .gov website. Share sensitive
information only on official, secure websites.
Mutation distribution
Light gray indicates low IC50; intermediate gray, intermediate IC50; dark gray, high IC50; and black, unknown IC50.
*Seven patients harbored more than 1 mutation (6 harbored 2 and 1 harbored 3).