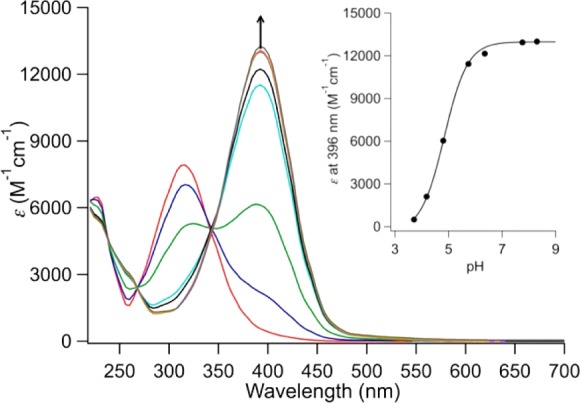
Figure 6.

UV–vis spectrum of [MnII(HBET–NO2)]2– as a function of pH between pH 3 and 9. Arrow denotes increase in 396 nm absorbance with increasing pH. Inset: Absorbance at 396 nm as a function of pH. Solid line represents fit to data giving a pKa of 4.84.
