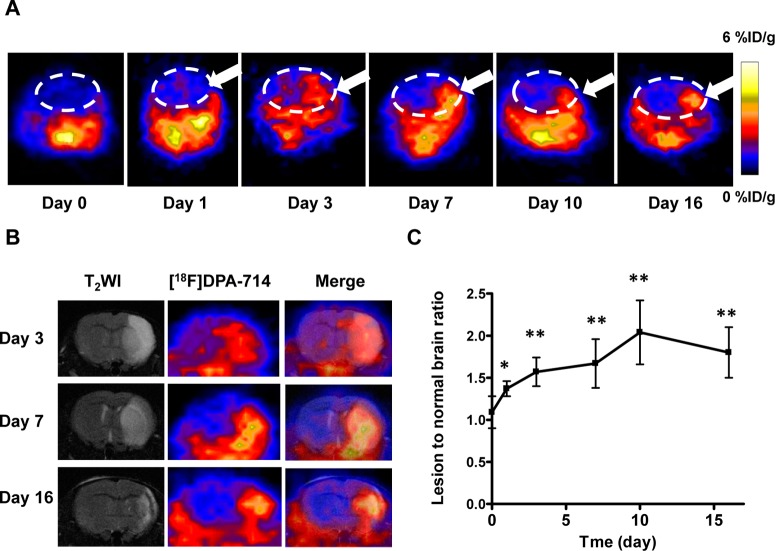
Figure 1.
[18F]DPA-714 PET imaging of TSPO expression. (A) Representative coronal PET images of [18F]DPA-714 at the lesion area after surgery. The white dashed line shows the brain area and the white arrow the damaged region. (B) Representative coronal T2-weighted MRI, [18F]DPA-714 PET, and coregistered images at different time points after MCAO surgery. (C) Quantification of [18F]DPA-714 uptake over time after MCAO surgery. The uptake ratio increased significantly from day 1 to day 16 compared with the baseline level before surgery (*p < 0.05; **p < 0.01).

