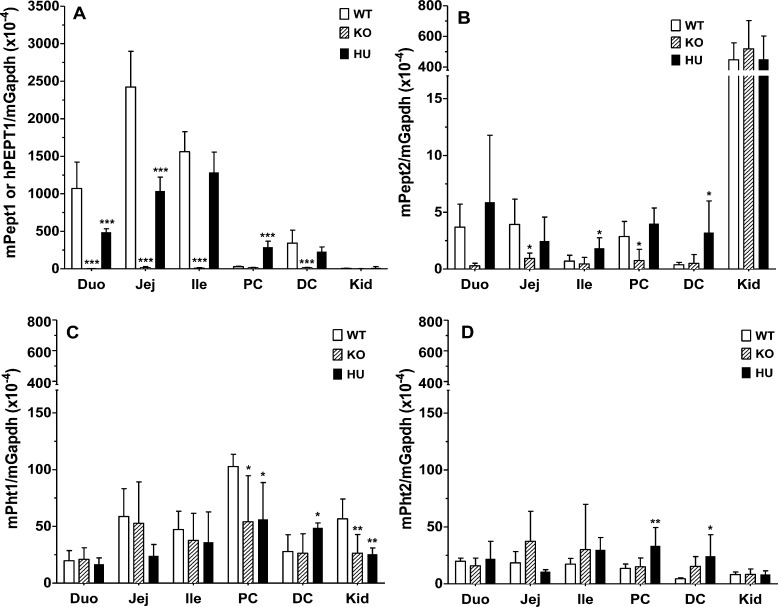
Figure 2.
Real time-PCR analyses of mPept1 or hPEPT1 transcripts (A), mPept2 transcripts (B), mPht1 transcripts (C), and mPht2 transcripts (D) in the small intestine, colon, and kidney of wildtype (WT = mPept1+/+), Pept1 knockout (KO = mPept1–/–), and humanized PEPT1 (HU = mPept1–/–/hPEPT1+/–) mice. Gene expression was normalized by mGapdh. Duo represents the duodenum, Jej the jejunum, Ile the ileum, PC the proximal colon, DC the distal colon, and Kid the kidney. Data are expressed as mean ± SE (n = 4–6). *p < 0.05, **p < 0.01, and ***p < 0.001, as evaluated by ANOVA/Dunnett’s analyses in which WT was the control group. Note the discontinuous y-axis in panels B–D and the different scaling compared to panel A.

