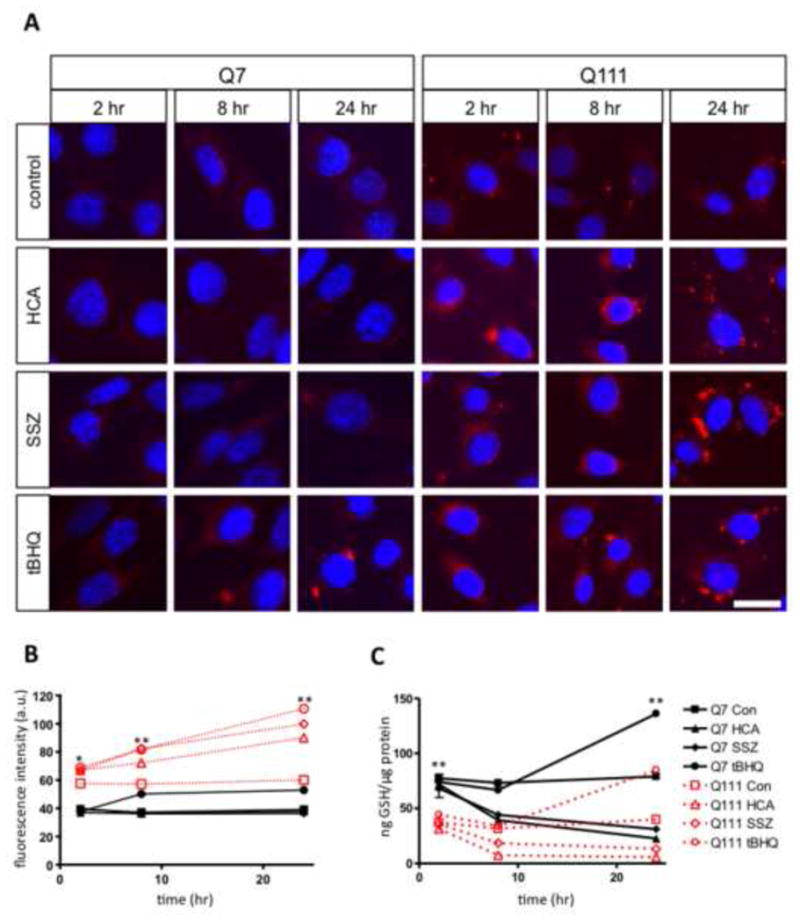
Figure 6.

GSH content was decreased and ROS expression was increased in STHdhQ111/Q111 cells. A, STHdh cells treated with vehicle (control), 1 mM HCA, 100 μM SSZ, and 100 μM tBHQ for 2, 8, and 24 hours. Nuclei were stained with DAPI and ROS with CellROX Deep Red Reagent; scale bar 25 μm. B, Quantification of fluorescence intensity from cells treated with CellROX Deep Red Reagent. Errors bars represent SEM; two-way ANOVA main effect of treatment by cell type: F(7, 785)=532.3, p<0.001; main effect of time: F(2, 785)=160.4, p<0.001; interaction: F(14, 785)=30.4, p<0.001) followed by Tukey's multiple comparison test: * p<0.05 (comparing STHdhQ7/Q7 control cells to STHdhQ111/Q111 control cells), ** p<0.01 (comparing STHdhQ7/Q7 control to tBHQ treated cells; and STHdhQ111/Q111 control to HCA, SSZ, and tBHQ treated cells), n=50; Kruskal-Wallis followed by Dunn's post hoc test, p<0.001. C, Total GSH levels in STHdh cells treated with vehicle (control), 1 mM HCA, 100 μM SSZ, and 100 μM tBHQ for 2, 8, and 24 hours. Error bars represent SEM; n=3 two-way ANOVA main effect of treatment by cell type: F(7, 24)=281.5, p<0.001; main effect of time: F(2, 24)=75.6, p<0.001; interaction: F(14, 24)=59.4, p<0.001) followed by Tukey's multiple comparison test, **p<0.01 (comparing basal GSH levels in control STHdh cells; and treated and control STHdh cells at 24 hrs); Kruskal-Wallis followed by Dunn's post hoc test, p<0.01.
