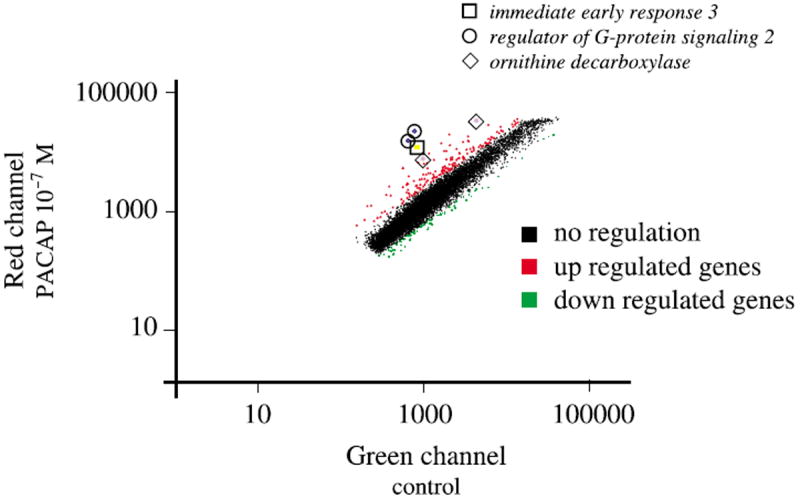
Fig. 2.

Scatter plots illustrating the effect of PACAP treatment on PC12 cells gene expression profile. The mRNA levels of expression were compared for cells treated in the absence or presence of PACAP (10−7 m) for 6 h (a). Red dots, genes that are up regulated > 2-fold; green dots, genes that are down regulated > 2-fold. Boxes indicate the relative expression of the three top candidates after PACAP treatment; □, immediate early response 3; ○, regulator of G-protein signaling 2; ◇, ornithine decarboxylase. Regulator of G-protein signaling 2 and ornithine decarboxylase are present in duplicate on the array. Only genes with a quality control > 0.3 have been represented on the graph.
