
Fig. 3.
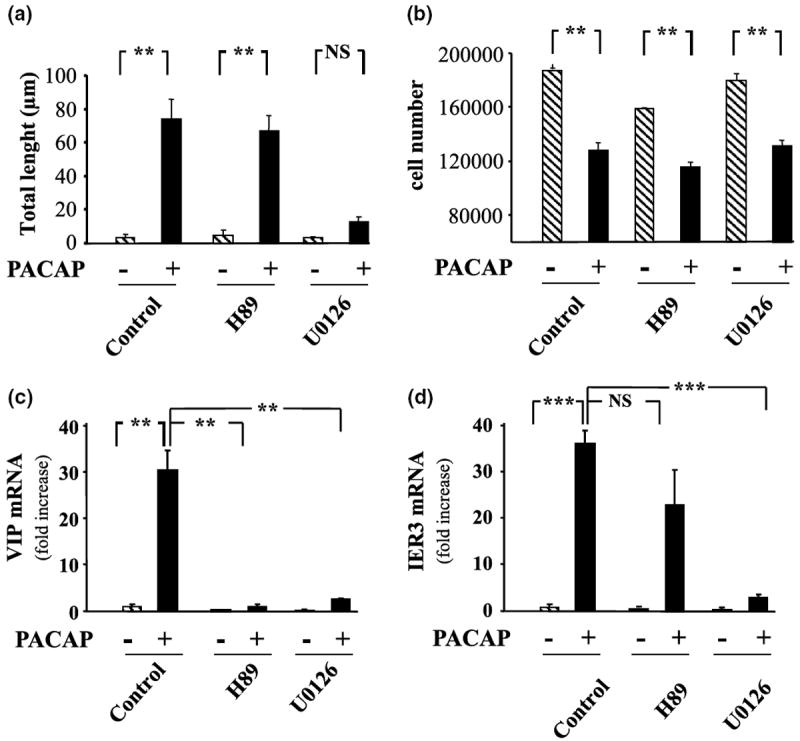
Effect of PACAP on PC12 cell differentiation. (a) Quantification of neurite total length 48 h after treatment with PACAP alone (10−7 m) or in the presence of the selective PKA inhibitor H89 (10 μm) or MEK inhibitor U0126 (25 μm). (b) Quantification of cell number 48 h after treatment with PACAP alone (10−7 m) or in the presence of the selective PKA inhibitor H89 (10 μm) or MEK inhibitor U0126 (25 μm). (c) Quantification of VIP mRNA levels after treatment with PACAP alone (10−7 m) or in the presence of the selective PKA inhibitor H89 (10 μm) or MEK inhibitor U0126 (25 μm) for 6 h. (d) Quantification of immediate early response three mRNA levels after treatment with PACAP alone (10−7 m) or in the presence of the selective PKA inhibitor H89 (10 μm) or MEK inhibitor U0126 (25 μm) for 6 h. Each value represents the mean fold increase (± SEM) compared to the control level of two independent experiments performed in triplicate. Data were corrected using GAPDH signal as internal control. Statistical value significantly different **p < 0.01, ***p < 0.001, from respective control. NS, not significantly different from control.