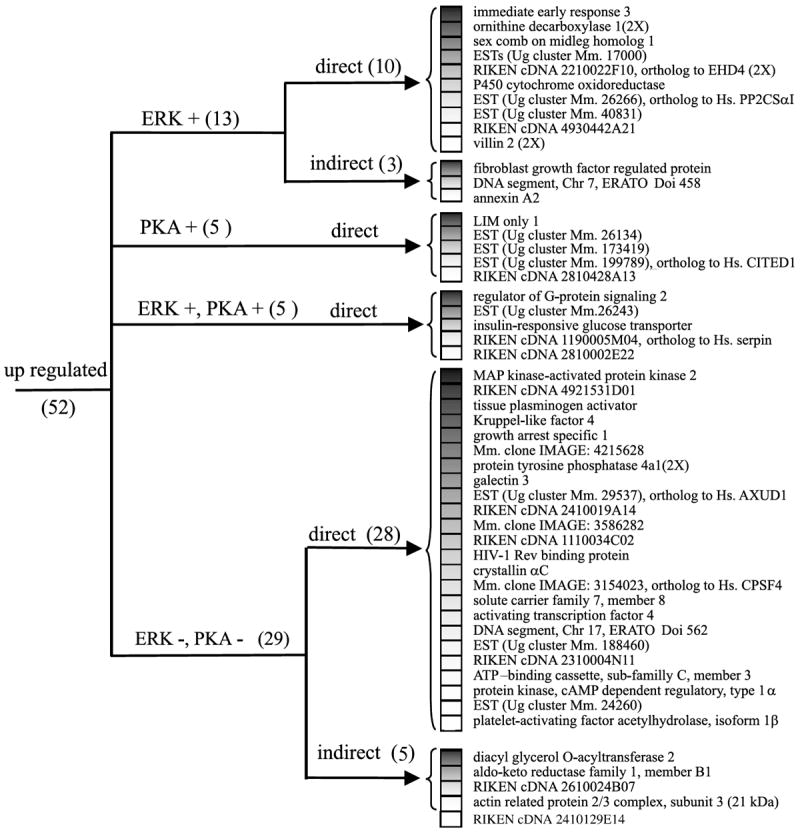
Fig. 4.

Cluster analysis of the expression pattern of the genes activated after PACAP treatment. Genes were organized according to their regulation expression profile after treatment with H89 (10 μm), U0126 (25 μm) and cycloheximide (5 μm). AXUD1, axin1 up regulated 1; CITED1, CBP/p300-interacting transactivator with Glu/Asp-rich carboxy-terminal domain 1; CPSF4, cleavage and polyadenylation specific factor 4, 30 kDa subunit; Hs., homo sapiens; Mm., mouse musculus; PKA, protein kinase A; PP2CSαI, protein phosphatase 2 catalytic subunit α isoform; Ug, unigene.
