
Fig. 6.
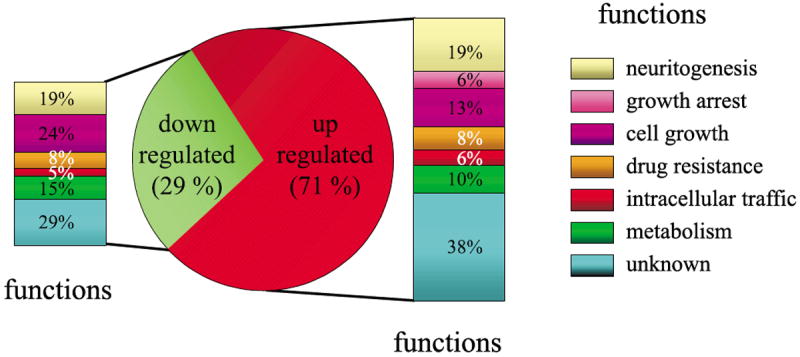
Genes were assigned to a functional class based on their established or suggested function. The pie chart shows the repartition of messengers up or down regulated after 6 h of treatment with PACAP and the histograms indicate the functional repartition these genes.