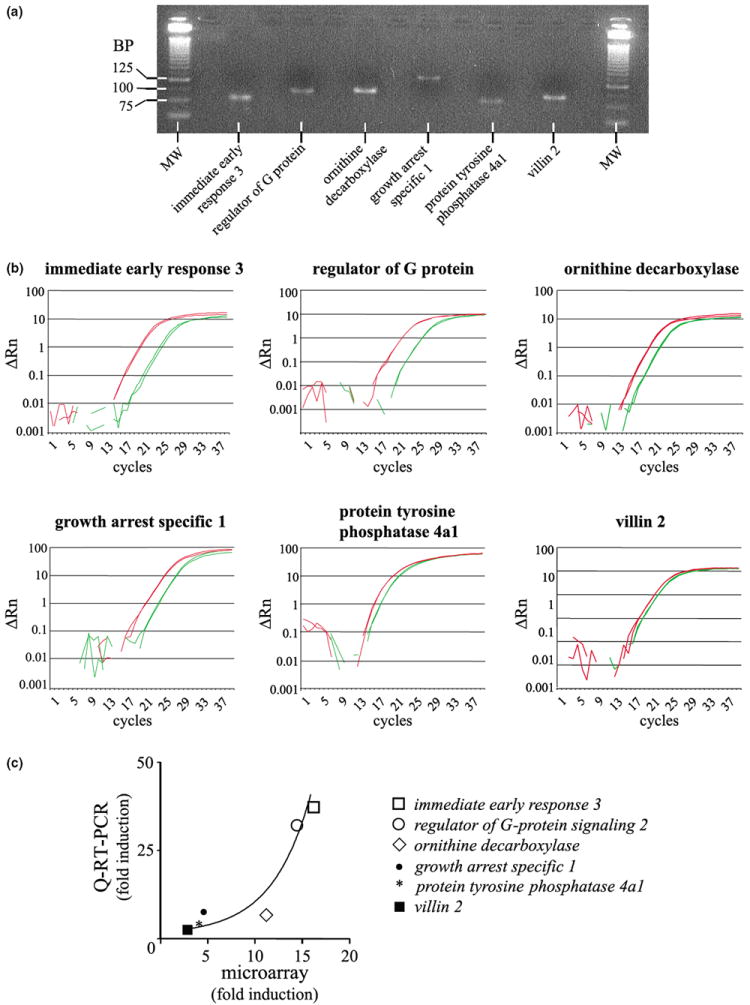
Fig. 7.

Independent verification of representative genes regulated by PACAP in PC12 cells. (a) Representative amplicons after migration on a 3% agarose gel in TBE. MW, molecular weight; BP, base pair. (b) Quantification of immediate early response 3, regulator of G-protein signaling 2, ornithine decarboxylase, growth arrest specific 1, protein tyrosine phosphatase 4a1 and villin 2 expression level by Q-RT-PCR after 6 h in the absence or presence of PACAP (10−7 m). For each gene of interest, Q-RT-PCR plots of control-treated samples are in green while Q-RT-PCR plots from PACAP-treated samples are in red. (c) Correlation profile of the level of expression observed by microarray and Q-RT-PCR.
