FIGURE 3.

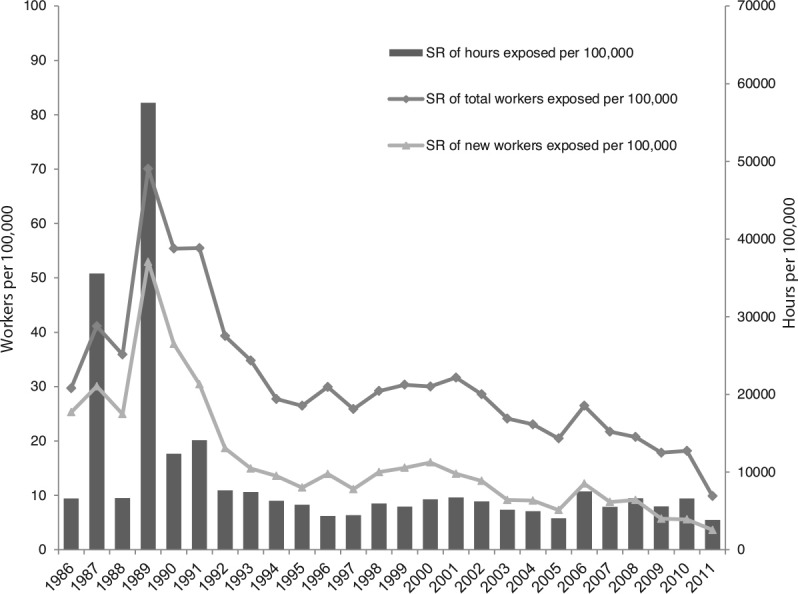
Standardized rates (standardized by age and sex distribution of 2011 labor force in Ontario) of exposure by current and first date of employment per 100,000 workers. SR, standardized rate.

Standardized rates (standardized by age and sex distribution of 2011 labor force in Ontario) of exposure by current and first date of employment per 100,000 workers. SR, standardized rate.