
Figure 3. Surpabasal Ki67 staining in footpad and back skin of IIA KO mice.
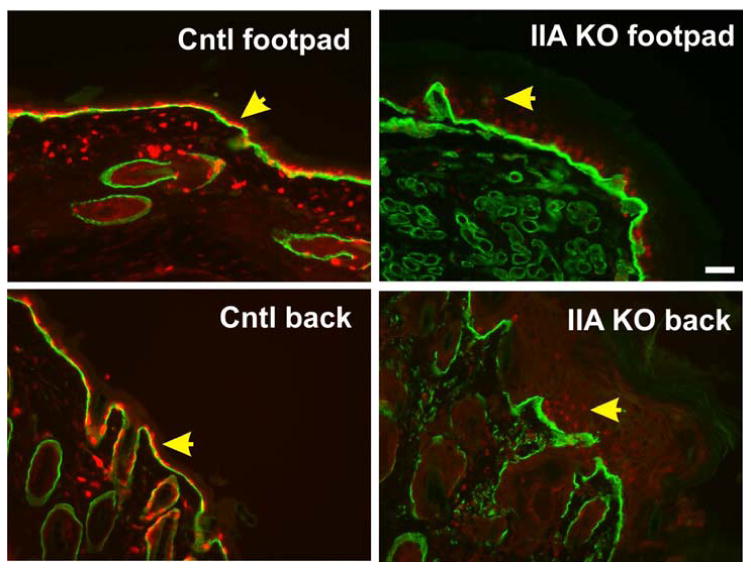
Tissues from control littermate and IIA KO P13 mice were fixed, sectioned, and stained for Ki67 (red) and alpha 6 integrin (green). Yellow arrowheads indicate single basal layer of Ki67 positive cells in control samples and suprabasal Ki67 staining in the IIA KO samples. In both locations we note that Ki67 staining, while suprabasal in the IIA KO, also displayed a weaker signal in all cells. Scale bar, 50 μm.