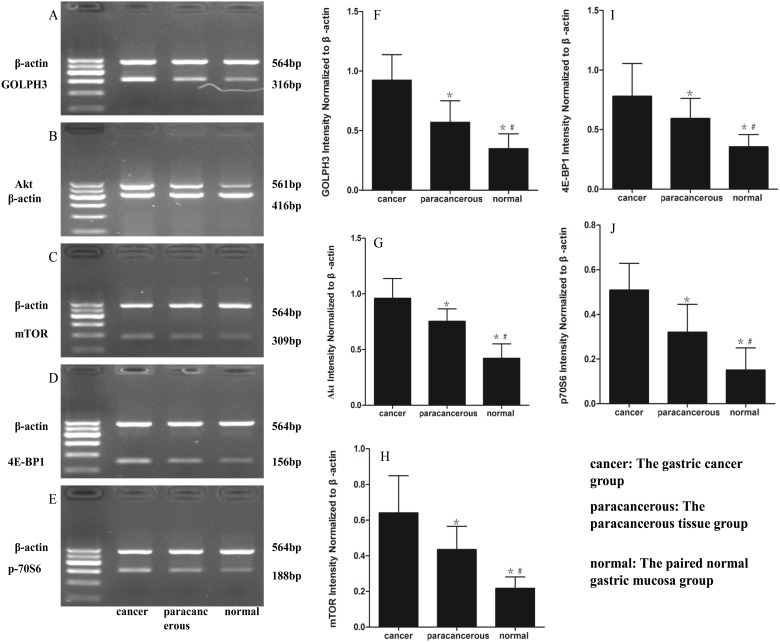
Figure 2. Representative images showed semi-quantitative RT-PCR for GOLPH3, Akt, mTOR, 4E-BP1 and p70S6 transcription.
cancer: The gastric cancer group (n = 80); paracancerous: The paracancerous tissue group (n = 80); normal: The paired normal gastric mucosa group (n = 80). A, B, C, D and E: The mRNA levels of GOPLH3, Akt, mTOR, 4E-BP1, p70S6 in the different measured by RT-PCR, respectively. F, G, H, I and J: Densitometric quantification of GOLPH3, Akt, mTOR, 4E-BP1 and p70S6 mRNA expression in different tissues, respectively. The mRNA expression was significantly different with each other and peaked at cancer. The data are presented as the mean ± the SE. *p<0.05 versus cancer, # p<0.05 versus paracancerous.

