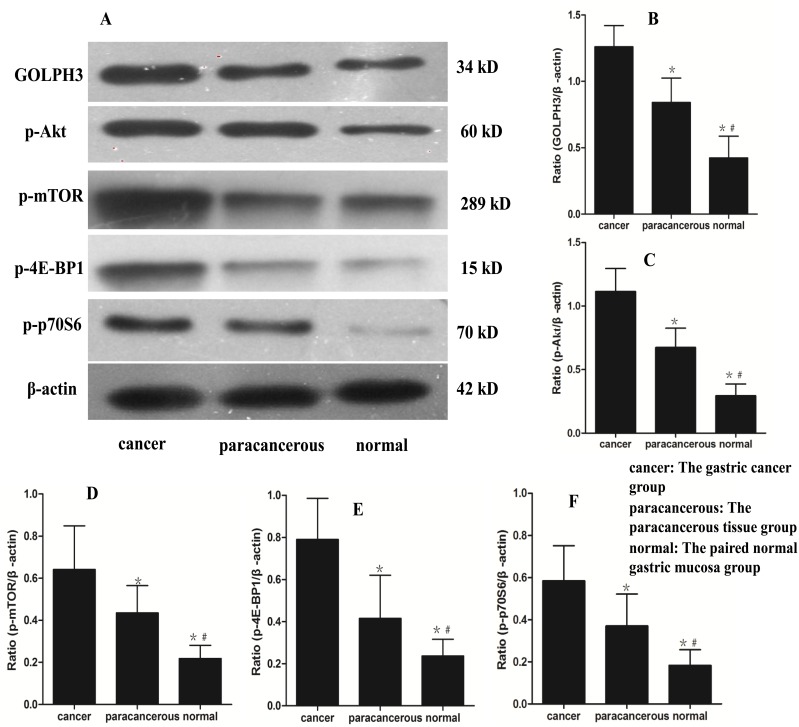
Figure 3. The GOPLH3, p-Akt, p-mTOR, p-4E-BP1 and p-p70S6 protein levels in the different tissues.
A: The protein levels of GOPLH3, p-Akt, p-mTOR, p-4E-BP1 and p-p70S6 in the different measured by western blotting. B, C, D, E and F: The GOPLH3, p-Akt, p-mTOR, p-4E-BP1 and p-p70S6 protein levels in the different tissues, respectively. cancer: The gastric cancer group (n = 80); paracancerous: The paracancerous tissue group (n = 80); normal: The paired normal gastric mucosa group (n = 80). The data are presented as the mean ± the SE. *p<0.05 versus cancer, # p<0.05 versus paracancerous.

