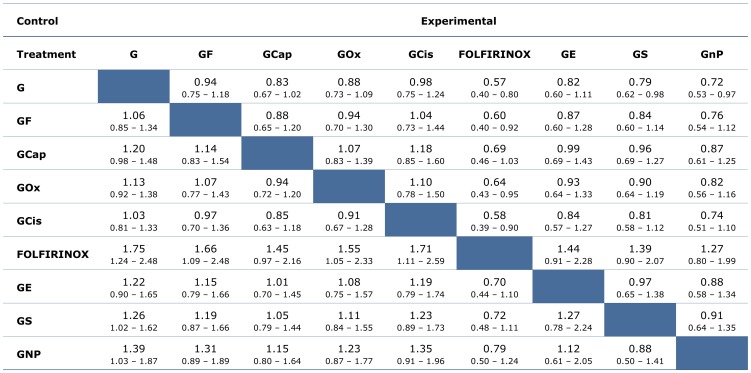
Figure 4. Hazard ratio comparisons of overall survival (OS) from mixed treatment comparisons.
Median values given with 95% credible regions. Hazard ratios (HRs) expressed as experimental vs. control. G, gemcitabine; GF, gemcitabine + fluorouracil; GCap, gemcitabine + capecitabine; GOx, gemcitabine + oxaliplatin; GCis, gemcitabine + cisplatin; FOLFIRINOX; GE, gemcitabine + erlotinib; GS, gemcitabine + S1; GnP, gemcitabine + nab-paclitaxel.

