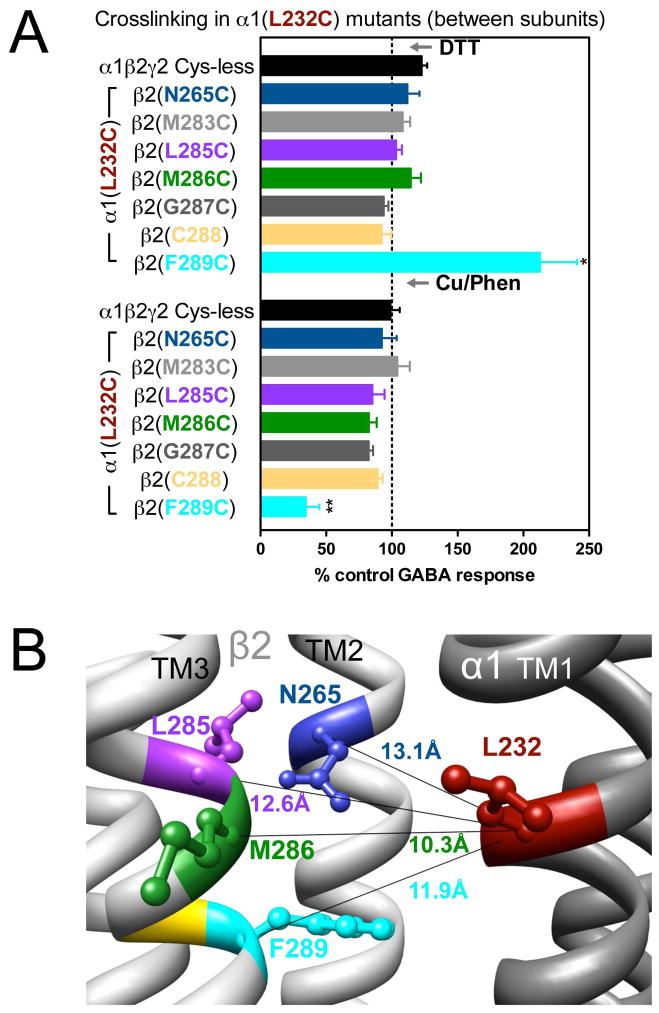
Figure 3.
Inter-subunit crosslinking:
 (TM1) and cysteines in TM2 and TM3 of β2 subunit. A. GABA responses after DTT and Cu++:Phen application [EC50 GABA were used, except for
 , in which spontaneous crosslinking prevented measuring EC50, therefore 100 μM GABA was used). *p< 0.05 versus Cys-less receptor; two-way ANOVA, and Bonferroni post-tests (n= 5–7). B. The four closest amino acids to
 are shown, along with the respective Cα-Cα distances, as seen from the membrane, between β2 and α1 subunits.

