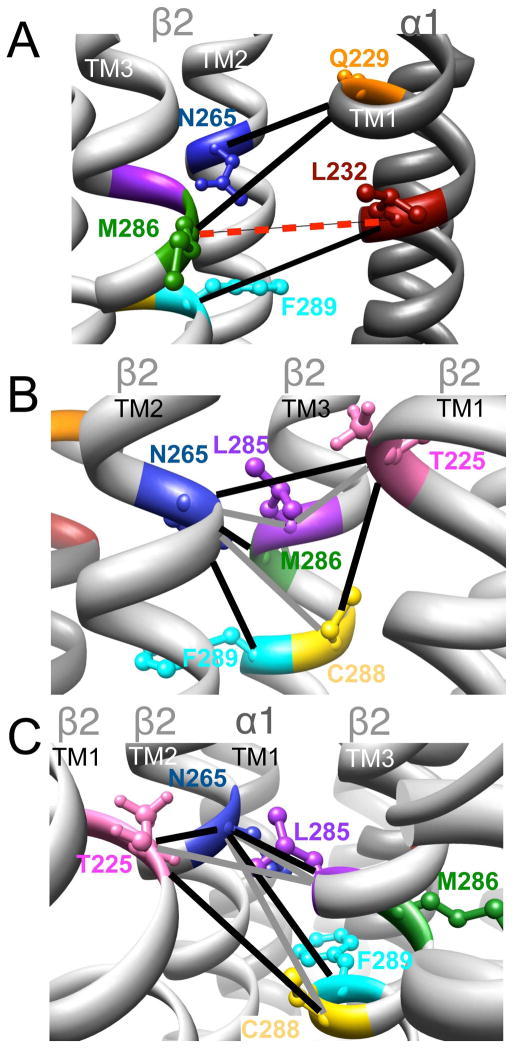
Figure 8.
Homology model of the α1β2γ2 GABAAR, with relevant amino acids and their interaction between (A) and within (B and C) subunits. A. Three cysteine pairs [
 ,
,
 , and
, and
 ] showed changes in GABA-induced responses (black lines) after redox treatment. The closest cysteine pair between the α1 and β2 subunits [
 ] did not show any evidence of crosslinking (dotted line, in red). B and C (same TMs from two different viewpoints). Four cysteine pairs within the β2 subunit [
 ,
,
 ,
,
 , and
, and
 ] showed changes in GABA-induced responses (black lines) after redox treatment, indicative of crosslinking. Three additional pairs [
 ,
,
 , and
, and
 ] showed changes in the butanol potentiation (grey lines) after redox treatment, indicative of “silent crosslinking”: GABA responses were not affected, but the effect of the drug binding at the pocket where the disulfide bridge occurs is modified.

