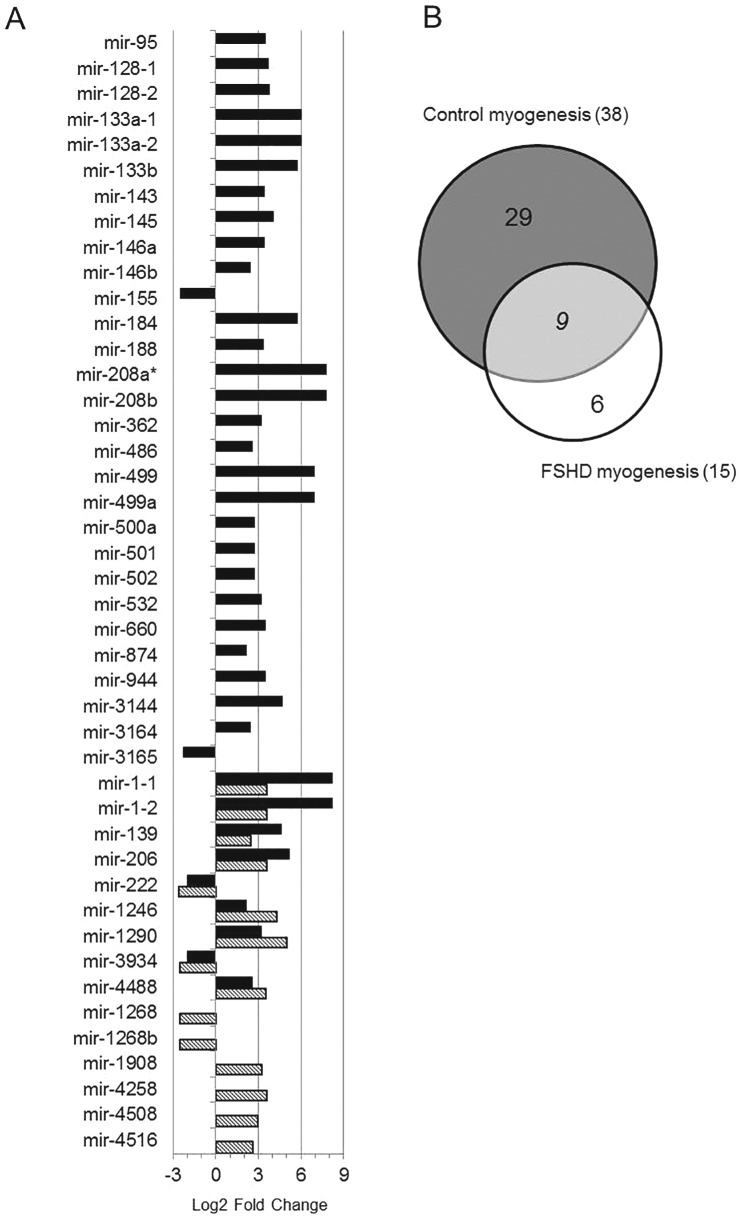
Figure 6. Comparison of miRNA modulation in control and FSHD myogenesis.
A) Black and striped bars identify the Fold Change of miRNAs modulated respectively, in control and FSHD myogenesis. Bars on the left and on the right represent, respectively, down- and up-regulated miRNAs. *hsa-mir-208a showed infinite FC value (see Table S3). B) Venn diagram showing the number of miRNAs unique to FSHD (white) or control (grey), and shared (light grey) by FSHD and control differentiation processes.

