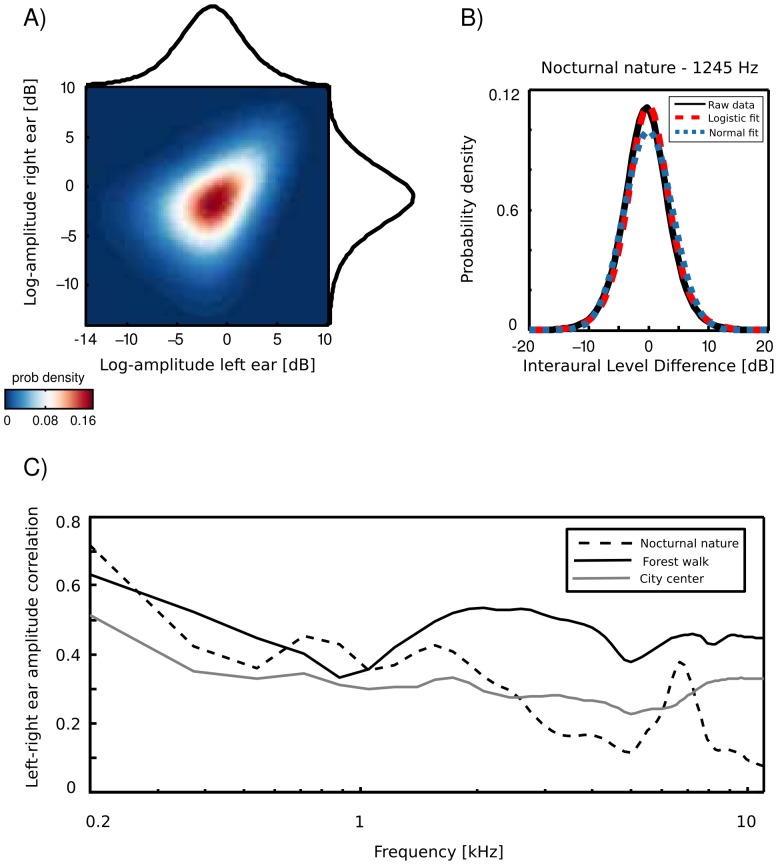
Figure 3. Binaural amplitude statistics.
A) An exemplary joint distribution of monaural amplitudes at  Hz. Exemplary data were taken from the nocturnal nature recording. B) An ILD distribution of the same data, plottedtoghether with a Gaussian and a logistic fit (blue and red dotted lines respectively) C) Interaural amplitude correlations across frequency channels

