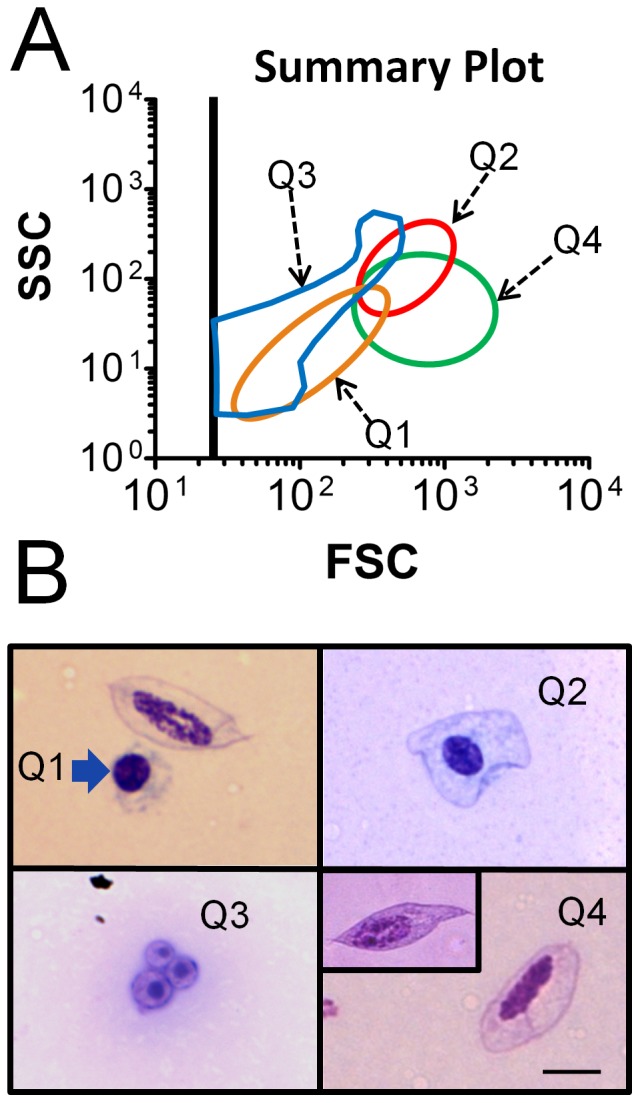
Figure 2. Association of flow cytometry light scatter profiles with particle types observed in Wright-stained smears.

A) Analysis of flow cytometry data from a total of 634 individual bees, including several common bee strains, resulted in a FSC vs SSC summary plot that provides information about size and complexity in particles observed in hemolymph. Colors of regions used in the summary plot match those shown in Figure 1. B) Photomicrographs of Wright-stained particles correspond to regions Q1-Q4 of the summary plot include Q1: image of a permeabilized cell (blue arrow) lacking an obvious plasma membrane (and plasmatocyte with plasma membrane for comparison), Q2: permeabilized cell surrounded by a plasma membrane, Q3: microparticles, and Q4: plasmatocyte with rounded termini (and pointed termini, inset). The scale bar represents 5 µm for all images.
