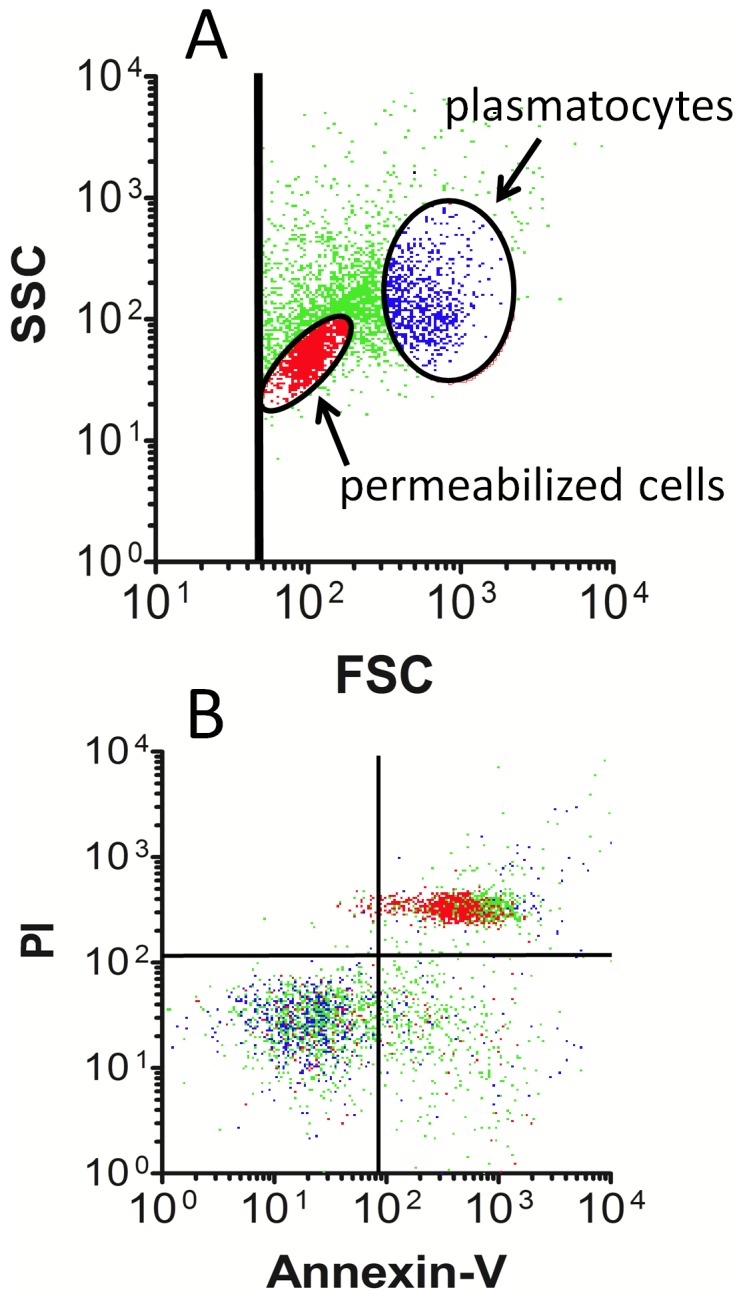
Figure 3. Honey bee hemocyte staining by annexin V.

Hemolymph from five bees was pooled and probed with both PI and annexin V, then examined by flow cytometry. A) Events displayed in the FSC vs SSC plot were used to locate regions corresponding to permeabilized cells (red dots) and plasmatocytes (blue dots), where overlap of cell types was minimal. Green dots represent microparticles and cells lying outside the selected regions. B) Fluorescence measurements obtained on particle subsets shown in A (using the same coloring scheme) indicate permeabilized cells are bound by annexin V and PI, while plasmatocytes were not labeled by either fluorochrome. The data are representative of 12 separate examinations involving hemolymph from 60 bees tested on three separate days.
