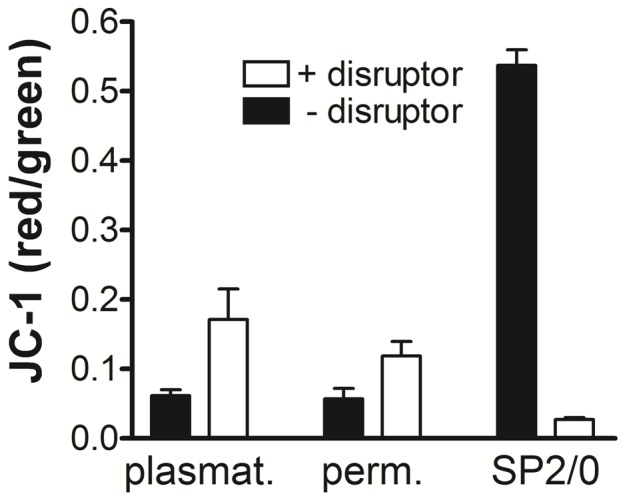
Figure 4. JC-1 staining to identify mitochondrial membrane activity in honey bee hemocytes.

Hemolymph samples from five bees were pooled and split into two equal volumes, then exposed to either the JC-1 probe alone, or JC-1 in the presence of the mitochondrial membrane potential disruptor, CCCP. Permeabilized cells and plasmatocytes were identified in FSC vs SSC plots, which were selected to determine the fluorescence intensity for the respective cell type. Bars represent the mean fluorescence intensity ratio (red/green) for replicates, both with (open bars) and without (filled bars) CCCP. Error bars define SEM, n = 7 samples; where each sample represents a pool of five unique bees. The murine SP2/0 cell line was used as a positive control. Data are representative of results obtained on two separate days.
