
Figure 7. Correlation of plasmatocyte WGA-FITC fluorescence to FSC in bees exposed to variable Varroa mite numbers.
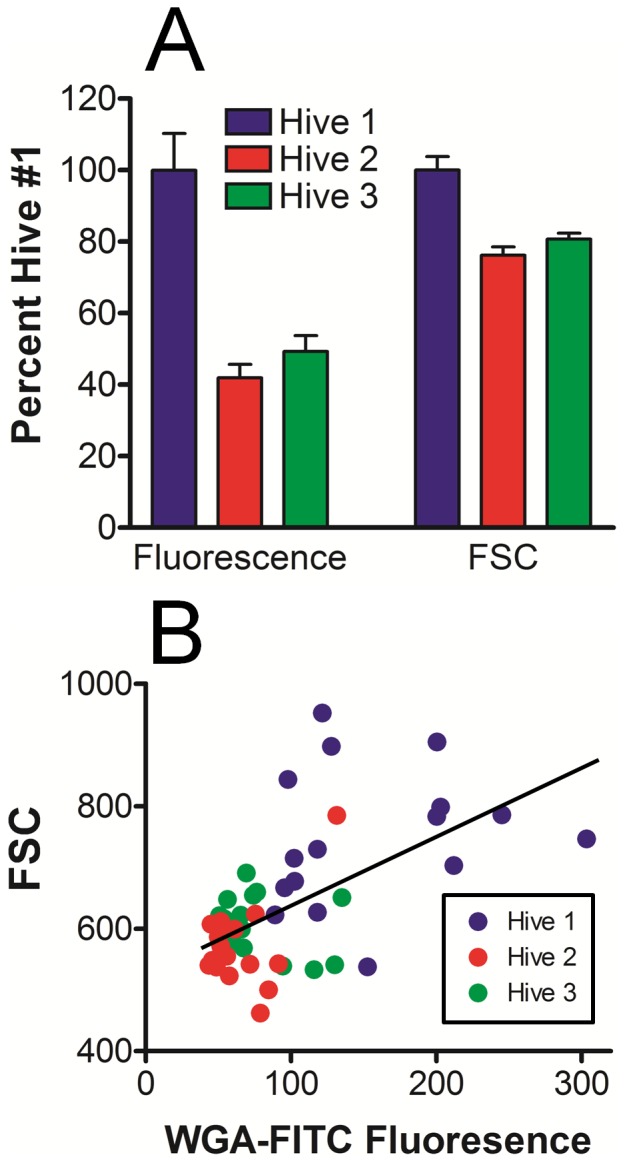
A) Plasmatocyte populations were selected from FSC vs SSC plots for bees represented in Figure 6B, then evaluated for both WGA-FITC fluorescence and FSC with respect to each hive. Plasmatocytes from bees in hive 1 showed significantly greater (P<0.001, n = 16) WGA-FITC labeling intensity and FSC values when compared to either hives 2 or 3. By contrast, plasmatocytes from hives 2 and 3 were not significantly different (P>0.05) for either parameter. B) Linear regression analysis for plasmatocytes from all hives collectively shows correlation (R2 = 0.33, P<0.001) of WGA-FITC labeling to FSC values, where color labeling of individual bees identifies the hive number.